

Video Analytics
Read the Video Analytics report: views, completion rate, lead captures, CTA activity, and the per-video breakdown.
Use this page to read the Video Analytics report and understand how each metric is counted.
Open Video Analytics in appPlayback is reported automatically for every video embedded with the snippet from the dashboard. There is nothing to enable and no separate tag to install; see Video analytics events for the underlying events.
Summary metrics
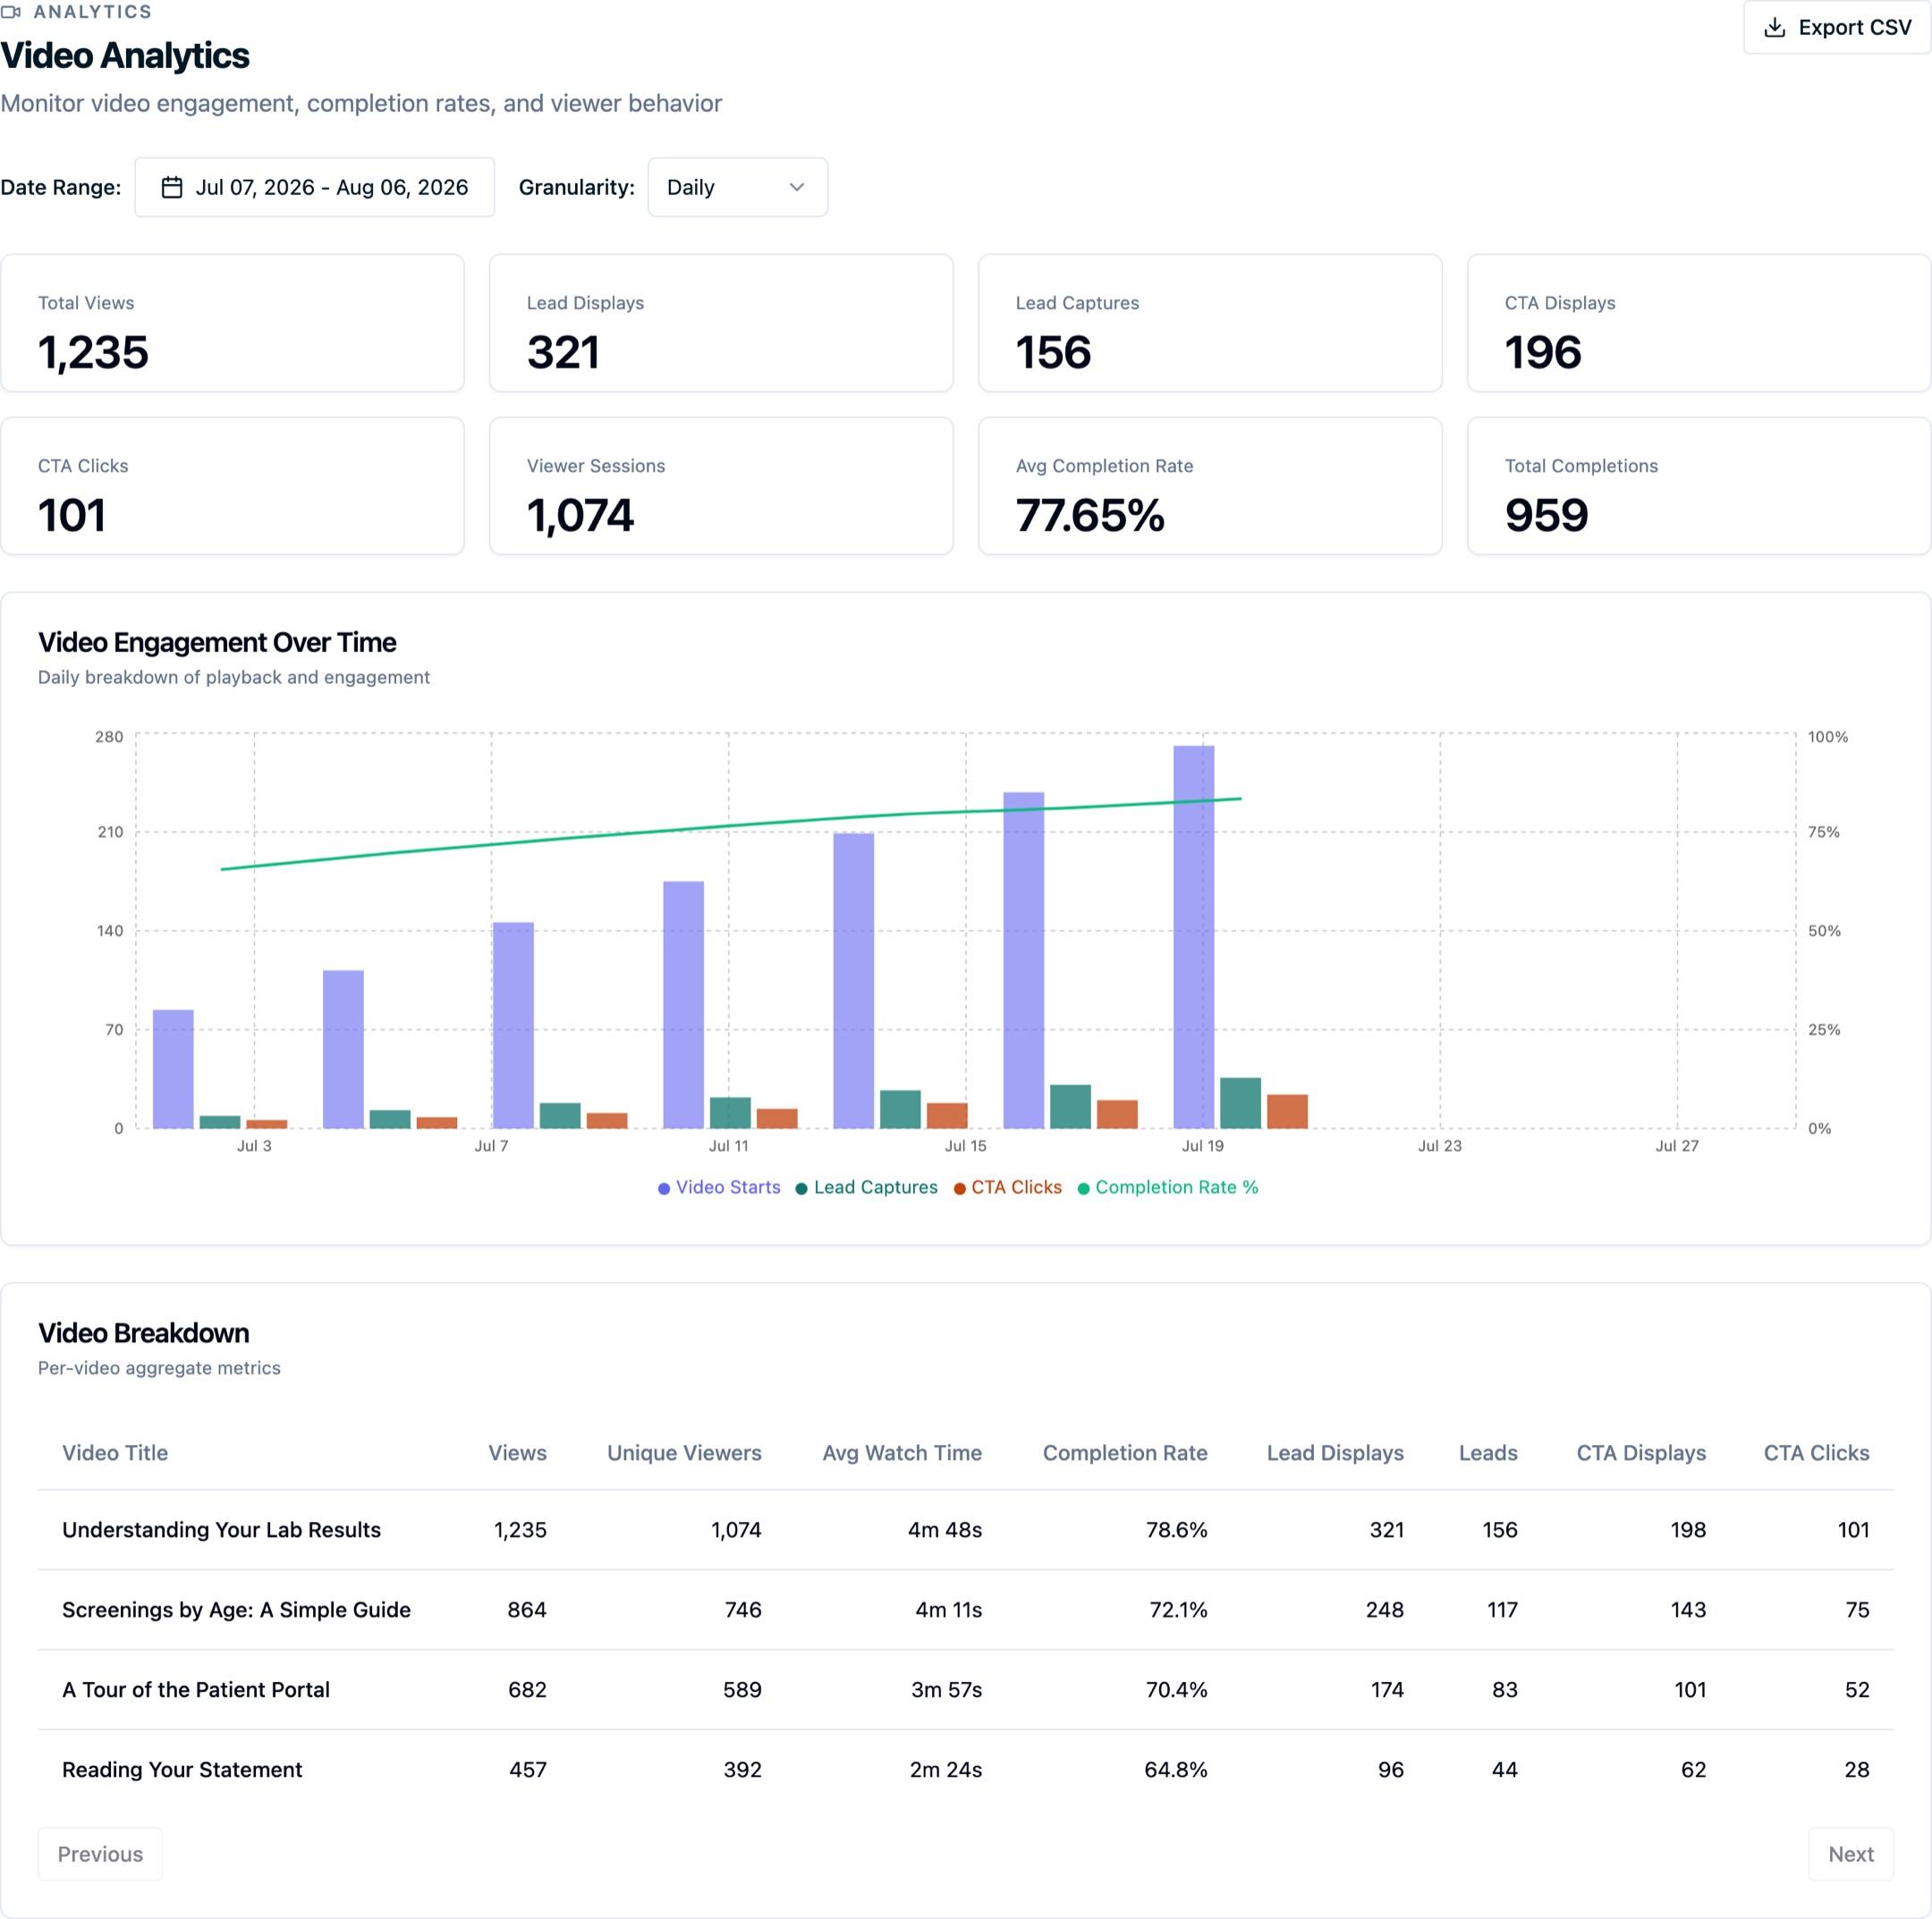
The summary cards at the top of the report cover the selected date range:
- Total Views. How many times a video started playing. The same person watching twice counts twice.
- Lead Displays and Lead Captures. How often configured email interactions appeared and how often a visitor submitted a valid email.
- CTA Displays and CTA Clicks. How often configured CTA interactions appeared and how often a visitor selected the CTA.
- Viewer Sessions. How many distinct visitors started a video. A visitor is identified by a first-party cookie, so one person on two devices counts twice.
- Avg Completion Rate. Completions divided by views, as a percentage.
- Total Completions. How many times a video reached the end.
Note: Completion rate can exceed what you would expect on looping video, and can look low on long video that viewers legitimately abandon partway. It measures reaching the end, not whether the video worked.
Video Engagement Over Time
The chart plots video starts, lead captures, and CTA clicks as bars against completion rate as a line, so you can see volume and quality of engagement together. Use it to spot the effect of a page change, a campaign launch, or a video swap.
Switch Granularity between Daily and Hourly. Hourly is capped at a 14 day range; picking a longer range with hourly selected trims the range rather than failing.
Video Breakdown
The table lists your videos individually for the same date range, ordered by views:
- Video Title. The title set on the video in the dashboard. Select it to open that video's own report.
- Views and Unique Viewers. The same counts as the summary cards, per video.
- Avg Watch Time. Total watched time across all video starts, divided by the number of starts. It averages every start, including those that never reached the end, so it reflects typical viewing length rather than just completed plays. Use completion rate to see how often videos reached the end, and the progress milestones in Video analytics events to see where viewers drop off.
- Completion Rate. Completions divided by views for that video.
- Lead Displays, Leads, CTA Displays, and CTA Clicks. The same interaction counts as the summary cards, for that video.
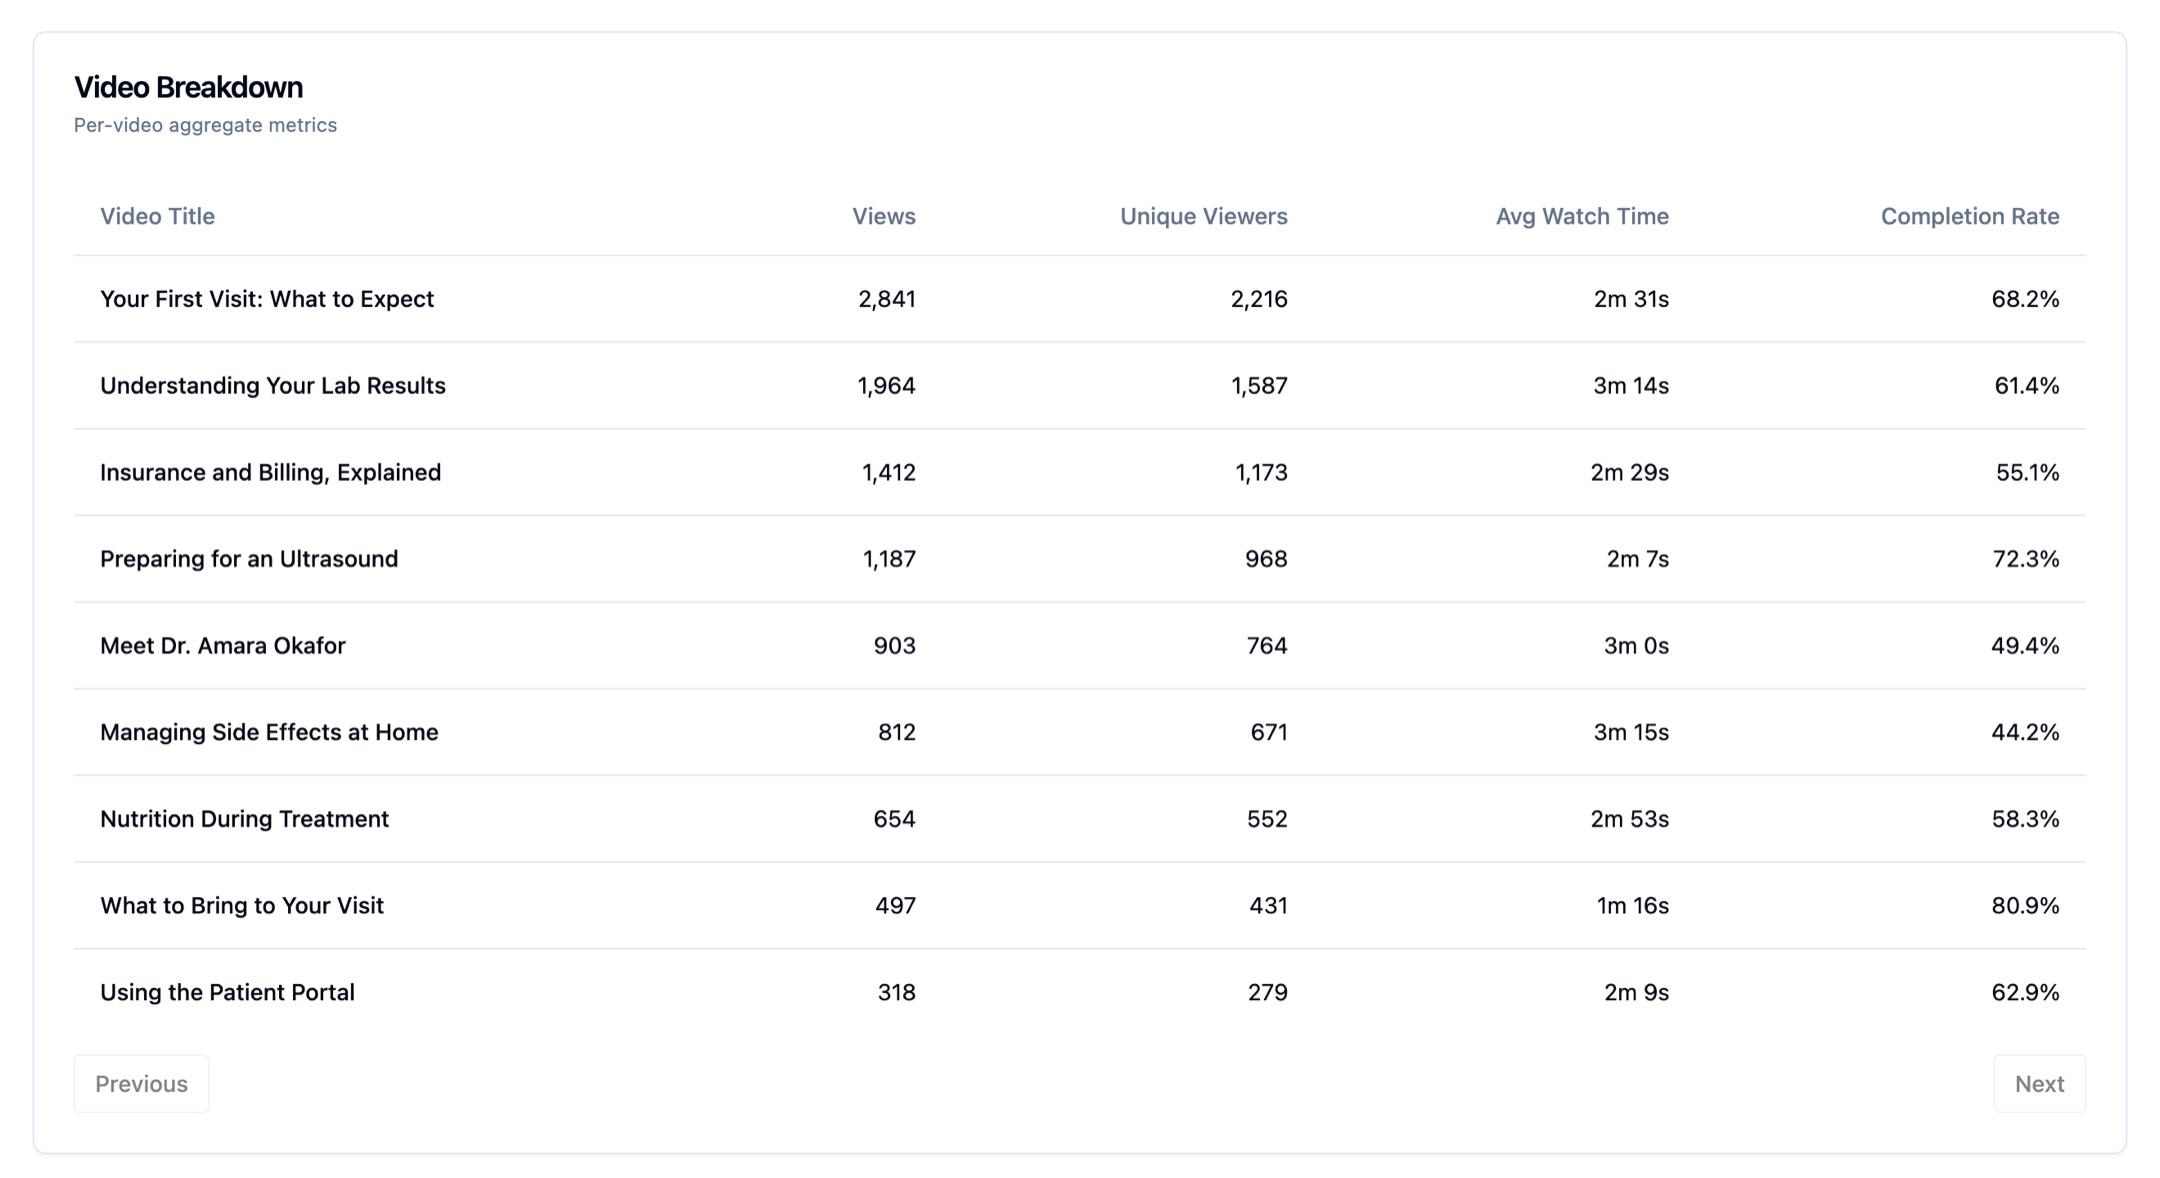
Videos appear 10 at a time; use Previous and Next to page through them.
A row showing Unknown as the title means events arrived without a title attached, usually from an embed generated before a title was set. Set a title on the video and future events report under it.
Single-video report
Selecting a title opens the same summary cards and engagement chart filtered to that one video. Use it to see how one video performs over time, and to check the effect of a page or campaign change around it.
Comparing two different videos means comparing two rows in the breakdown, or opening each video's report in turn. Replacing a video's file keeps it in the same row, so note the replacement date when you compare before and after. See Updating a video.
Reporting is per video, not per page
Every number in this report is grouped by video. The same video embedded on three pages reports as one row covering all three, and there is no page or landing-page filter in the report.
To break engagement down by page, use the video events in Web Analytics, where they carry the page they fired on like any other event. Or keep a video to one placement when you need to attribute its performance to a specific page.
Date range and delays
The report defaults to the last 30 days and accepts ranges up to 90 days. Events appear within a short delay of playback rather than instantly, so a video you just tested may take a few minutes to show up.
Export
Export CSV downloads the engagement time series for the current range and granularity: date, video starts, unique viewers, completions, lead capture displays, lead captures, CTA displays, CTA clicks, and completion rate. Use it to report outside the dashboard or to join video engagement to other reporting.
Who can see it
Video Analytics requires the video analytics reporting permission. If the report is not in your navigation, ask an admin in your account to grant it; see Policies and permissions.
Next steps
- Video analytics events: the exact events and properties behind these numbers.
- Video Lead Capture: configure the email and CTA interactions behind these metrics.
- Embed configuration: how autoplay and loop change what gets counted.
- Recipes: configurations aimed at engagement you can measure.
How is this guide?