

Journey Explorer
Walk the exact paths visitors take through your site one step at a time. Pin a start or end point and drill column by column to see where people went next, or what they did just before.
Journey Explorer walks the exact paths visitors take through your site, one step at a time. Pin a start or end point, then drill column by column to see where people went next, or what they did just before.
Open Journey Explorer in appEarly access. Journey Explorer is part of Journeys, which is rolling out gradually. Contact your account representative to turn it on for your organization.
Looking to measure drop-off across a fixed set of steps you define in advance? Use Funnels. Journey Explorer is open-ended: instead of defining the steps up front, you pin one step and let the paths visitors actually took reveal the next step for you.
What It Shows
Pick a step, and Journey Explorer shows you the most common next steps visitors took right after it within the same visit, ranked by how many took each one. Pin one of those steps and the next column shows what came after it, and so on. Walk far enough and you can trace a whole route through your site.
You can walk forward from a start point ("once someone did this, where did they go next?") or backward from an end point ("what did people do right before this?"). Steps can be page views, tracked events, or both.
Permissions
Journey Explorer uses the Web Analytics permission set:
| Permission | Capabilities |
|---|---|
| Web Analytics: View | Explore paths: change the date range and audience filters, walk every column, and read the results |
| Web Analytics: Write | All View capabilities, plus saving a filter combination as a reusable segment |
If you don't have the required permission, ask your account administrator to grant Web Analytics access.
Building a Report
Navigate to Attribution Center > Journey Explorer.
Step 1: Choose a Date Range and Audience
Set the date range for the paths you want to explore. Use the Filter button to scope the report to a subset of visitors with the same audience filters available across Web Analytics: UTM parameters, traffic source, location, device, browser, and more. You can also select a single web source and toggle whether bots are excluded. If you have Write access, save a filter combination as a segment to reuse it later.
Step 2: Choose Which Steps to Include
Use the step-kind toggle to decide what counts as a step:
| Option | Includes |
|---|---|
| All | Both page views and tracked events |
| Pages | Page views only |
| Events | Tracked events only |
Switching the step kind resets the walk.
Step 3: Pick a Direction and a Starting Step
In the first column, choose a walk direction:
- Start point walks forward: the columns to the right show what visitors did after the step you pin.
- End point walks backward: the columns show what visitors did before it.
Search the first column for the step you want, then click it to pin it. Pinning a step reveals the next column and scrolls it into view.
Step 4: Walk the Path
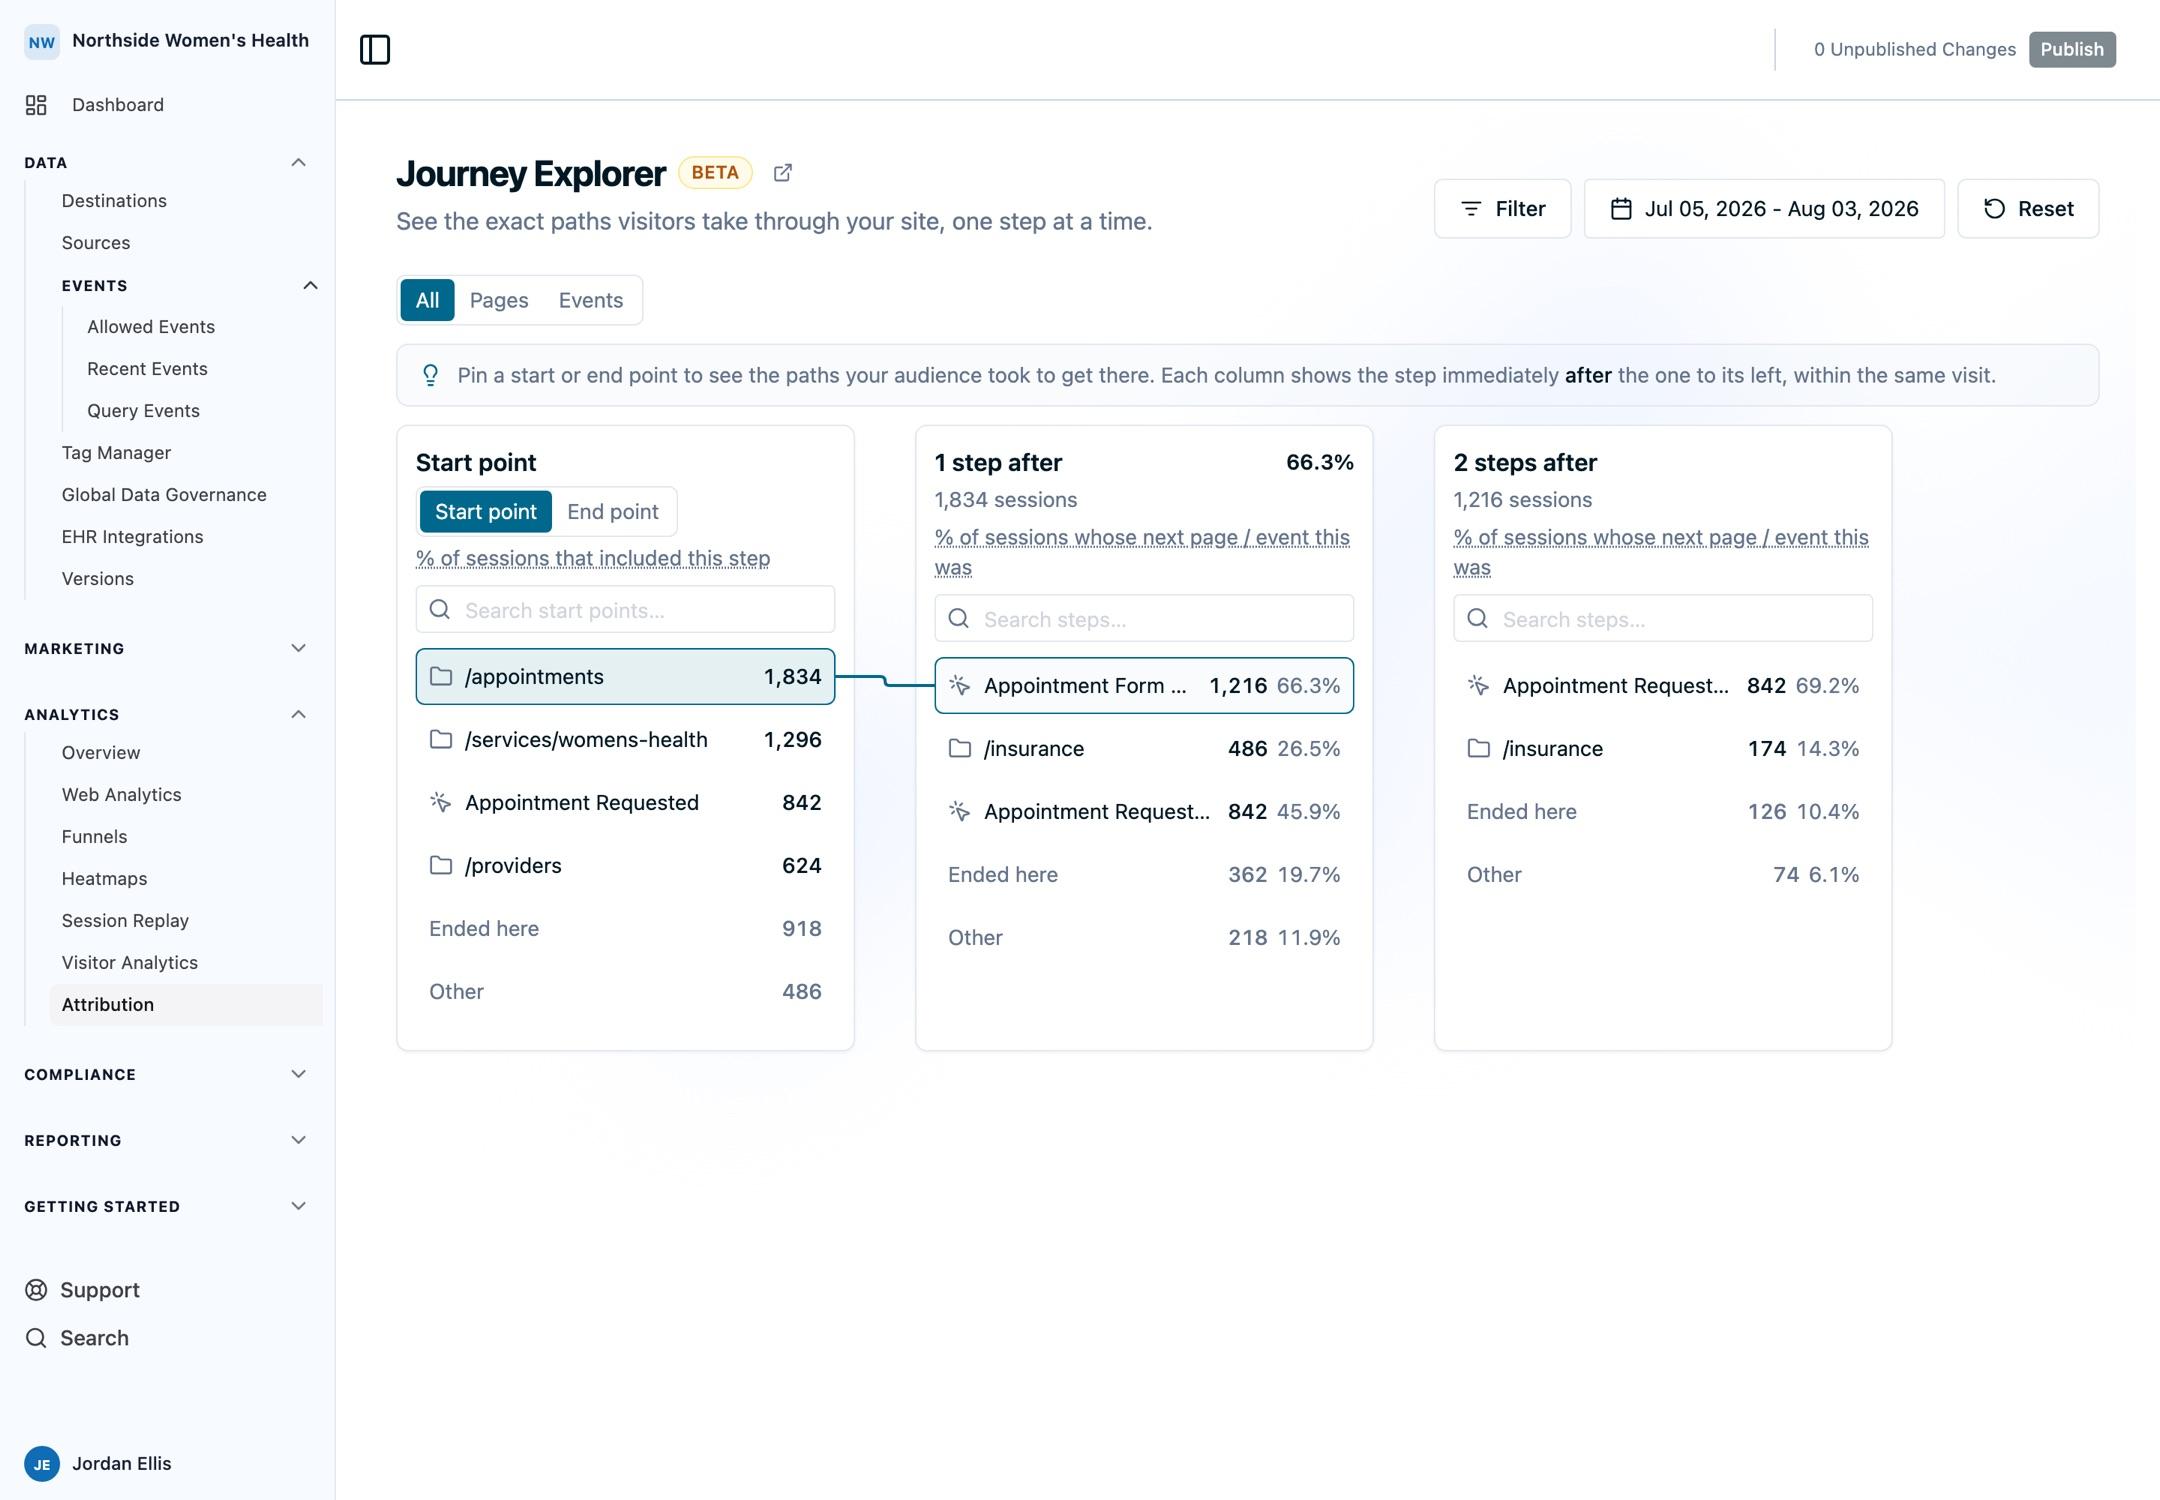
Each new column ranks the most common next (or previous) steps for the visitors who reached the pinned step. Click a step to pin it and open the following column, or click an already-pinned step to collapse everything to its right. Use the per-column search to find a specific step, and Show more to load additional steps in a column. Click Reset at any time to clear the whole walk and start over.
Reading the Columns
Each column represents one step in the path.
- Column heading. The first column reads Start point or End point. Each column after it reads 1 step after, 2 steps after, and so on (or 1 step before, 2 steps before when walking backward).
- Step rows. Each row shows the step, an icon for its type (page or event), the number of sessions that took that step, and its share of the column's sessions, with a proportional bar behind it.
- Percentages. In the first column, the percentage is the share of all sessions that included the step, counted independently for each step, so a session that touched several different steps is reflected in each of their shares. In later columns, it is the share of the previous step's sessions whose next step this was. When a column mixes pages and events (the All step kind), page steps and event steps are ranked against the same sessions, so their shares can add up to more than 100%; a Pages-only or Events-only column stays at or below 100%.
- Conversion rate. Once you pin a step, the column shows the share of the start step's sessions that reached it, so you can see how many visitors made it this far along the path.
- Ended here / Started here. A terminal row captures the sessions that went no further (or, when walking backward, had no earlier step). An Other row rolls up the long tail of less-common steps. Neither can be pinned.
- Small sample. When a column is built from fewer than 30 sessions, it carries a small sample badge, a reminder that the percentages there are noisy.
When to Use This Tool
Reach for Journey Explorer when you want to discover the paths visitors actually take, rather than measure a route you defined in advance. When the steps are known in advance and you want conversion and drop-off across them, use Funnels. When you want to summarize how converters reached a specific conversion event, use Conversion Journey Summary.
Next Steps
- Conversion Journey Summary: summarize the sources, timing, and page flow behind a conversion event.
- Funnels: measure conversion and drop-off across steps you define.
- Attribution FAQs: attribution models, date-range limits, exports, and more.
How is this guide?