

Conversion Journey Summary
Summarize how visitors reach a conversion: how many converted, how long it took, how many touchpoints, which sources started and closed the journey, and the page flow into the conversion.
Conversion Journey Summary traces how visitors reach a conversion. For a conversion event you choose, it summarizes the sources, timing, touchpoints, and page flow behind the people who converted.
Open Conversion Journey Summary in appEarly access. Conversion Journey Summary is part of Journeys, which is rolling out gradually. Contact your account representative to turn it on for your organization.
Want conversion credit split across every touchpoint using models like Linear or Time Decay? Use Conversion Attribution. Conversion Journey Summary answers a different question: what did the journeys of the people who converted actually look like, from first touch to conversion?
What It Shows
Pick a conversion event and Conversion Journey Summary describes the visitors who completed it: how many converted, how long their journeys took, how many touchpoints they had, which traffic sources started and closed those journeys, the most common ordered source paths, and the page flow that led into the conversion.
Permissions
Conversion Journey Summary uses the Web Analytics permission set:
| Permission | Capabilities |
|---|---|
| Web Analytics: View | Build and read a summary: change the conversion event, attribution window, date range, and audience filters |
| Web Analytics: Write | All View capabilities, plus saving a filter combination as a reusable segment |
If you don't have the required permission, ask your account administrator to grant Web Analytics access.
Building a Report
Navigate to Attribution Center > Conversion Journey Summary.
Step 1: Choose the Conversion Event
Select the event that counts as a conversion from the Conversion event dropdown. The list includes the events eligible as conversion goals and excludes high-volume automatic behaviors like page views, clicks, and scrolls.
Step 2: Choose an Attribution Window
The Attribution window sets how far back a journey's first touch is counted before the conversion. Choose 7, 14, 30, 60, or 90 days. A shorter window keeps the focus on recent touchpoints; a longer window captures journeys that started further in advance.
Step 3: Set the Date Range and Audience
Choose a date range of up to 60 days for the conversions you want to summarize. Use the Filter button to scope the report to a subset of visitors with the audience filters available across Web Analytics: UTM parameters, traffic source, location, device, browser, and more. You can select a single web source and toggle whether bots are excluded, and, with Write access, save a filter combination as a segment.
Step 4: Share a Summary
Every selection is captured in the page URL, so you can click Share to copy a link that reopens the same summary for a teammate.
Viewing Results
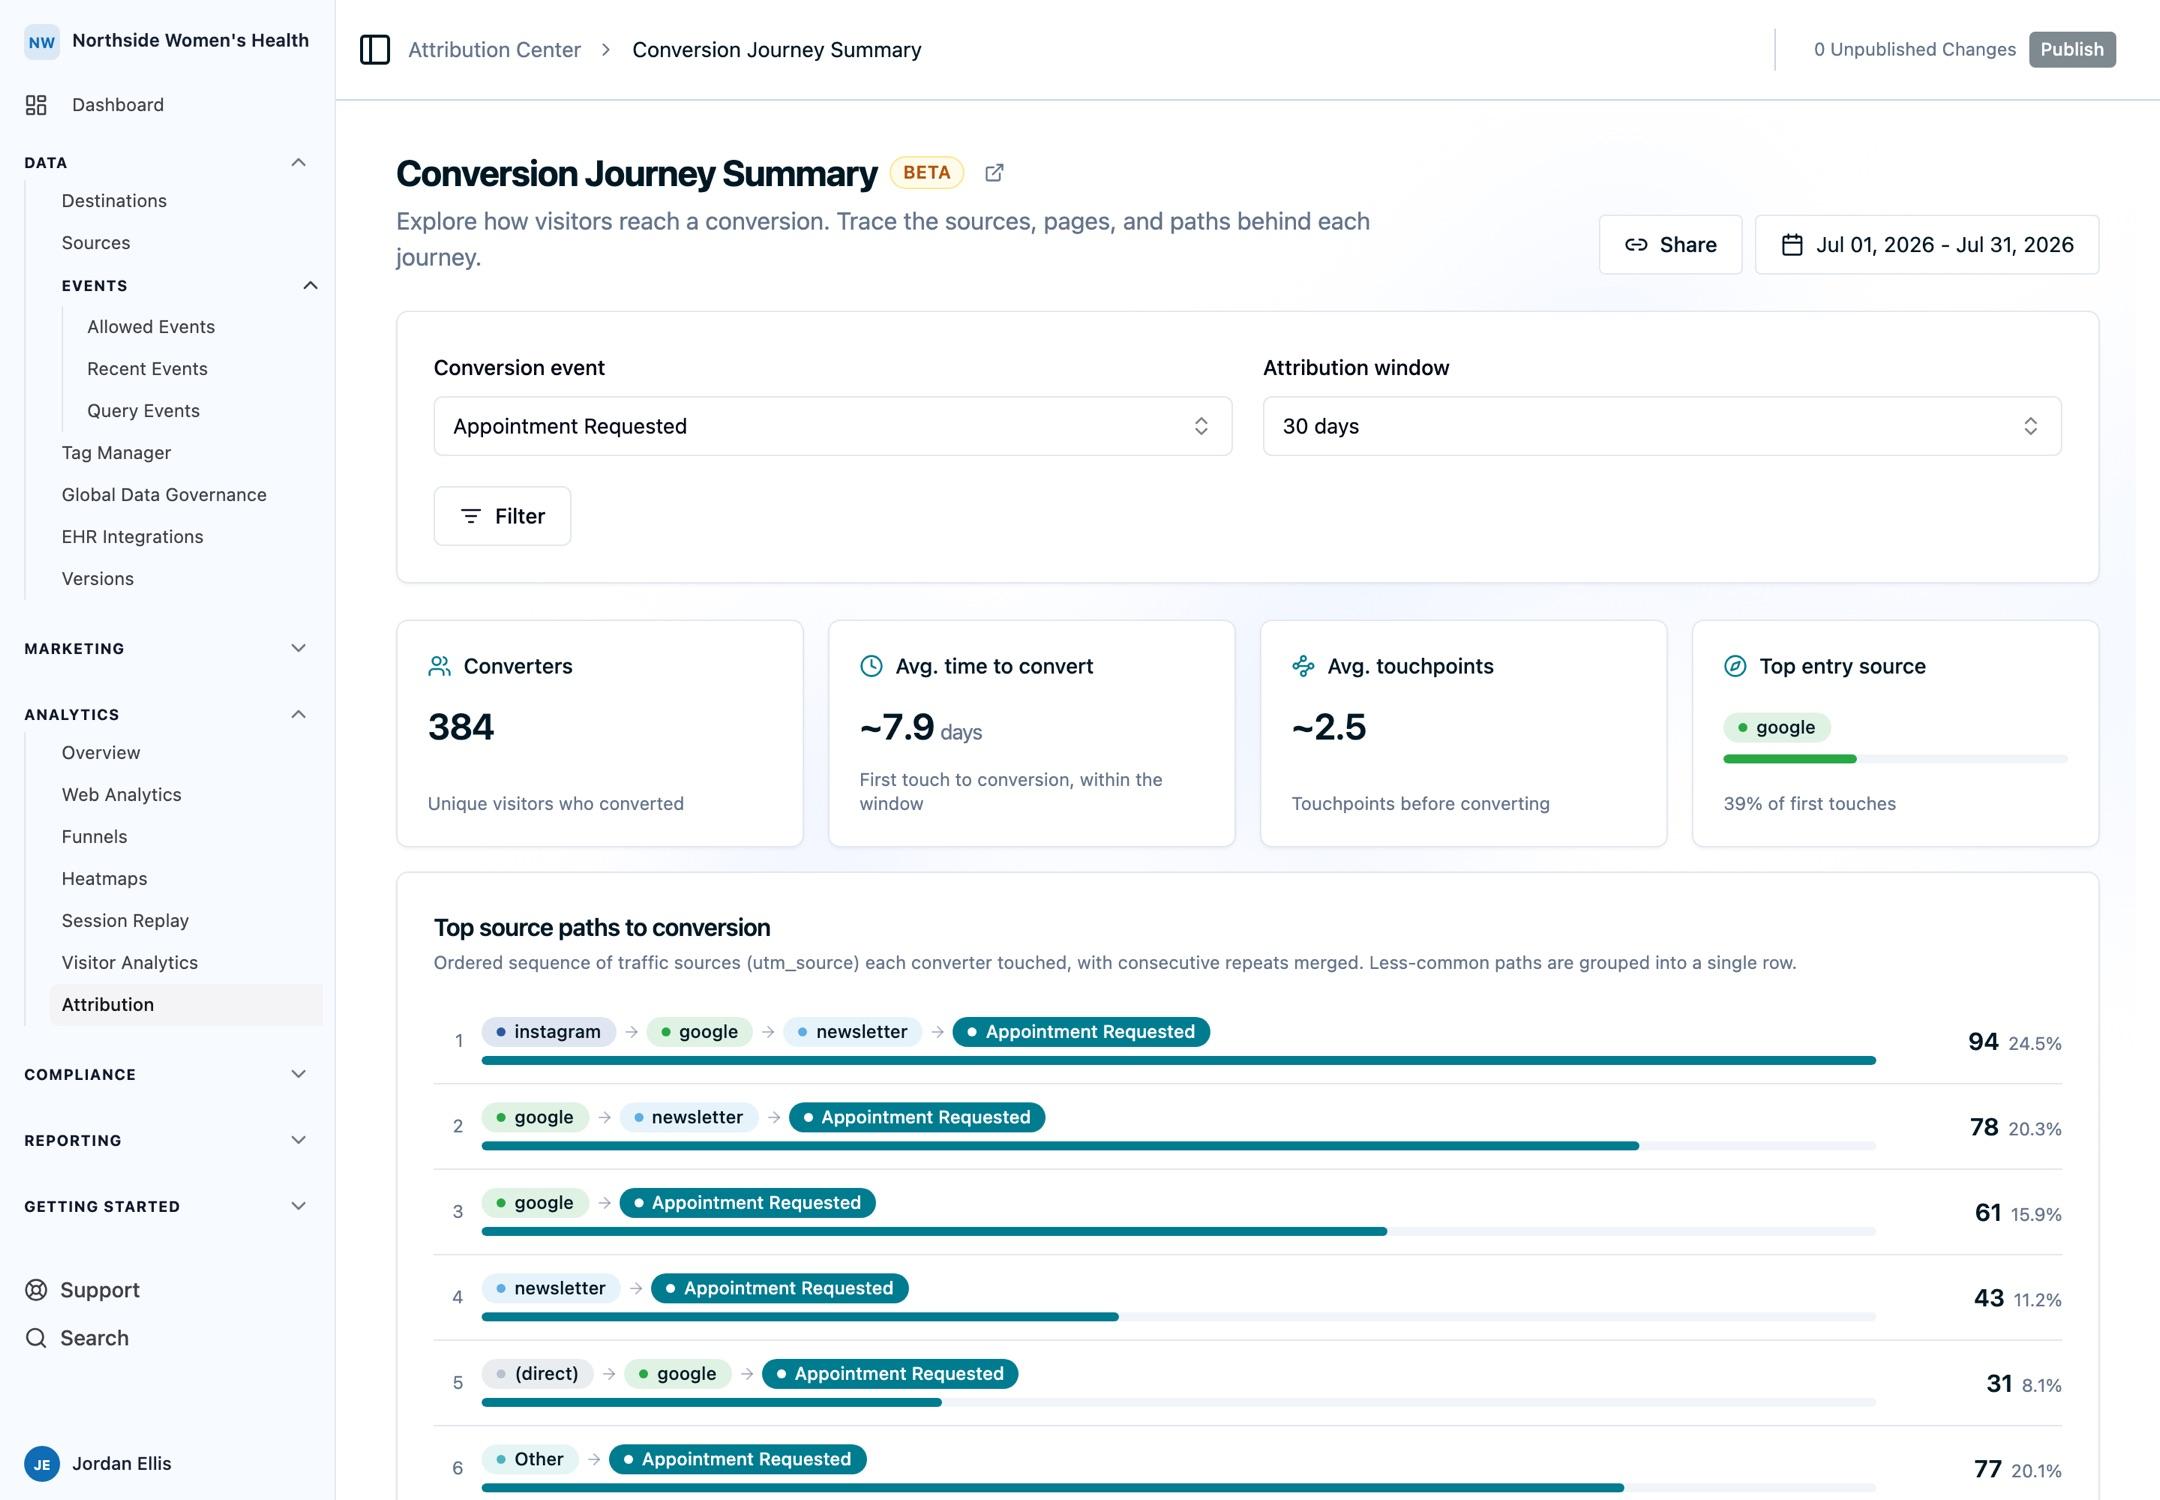
Summary Cards
Four cards summarize the converters over the selected range:
| Card | Description |
|---|---|
| Converters | Unique visitors who converted |
| Avg. time to convert | Average time from first touch to conversion, within the window |
| Avg. touchpoints | Average number of touchpoints before converting |
| Top entry source | The leading first-touch source and its share of all first touches |
Top Source Paths to Conversion
The ordered sequence of traffic sources each converter touched on the way to converting, with consecutive repeats of the same source merged into one. Each row shows the path as a series of source labels ending in the conversion, the number of converters who followed it, and its share of all converters. Less-common paths roll up into a single row so the most common routes stay readable.
Page Paths Before Conversion
A flow diagram that reads from the conversion backward: the page visitors were on just before converting, then the page before that, and so on. Ribbons are colored by traffic source, and a legend maps each color to its source. Hover a page or ribbon for a quick breakdown of converters and the sources behind it, or click one to open the full source, medium, and campaign drill-down.
Time, Touchpoints, and Touch Sources
Below the flow diagram, four panels break the journeys down further:
- Time to conversion: distribution of how many days journeys took, from first touch to conversion.
- Touchpoints to conversion: distribution of how many touchpoints journeys had before converting.
- First-touch source: ranked list of the sources that started the journeys. Click a source for its medium and campaign breakdown.
- Last-touch source: ranked list of the sources of the converting session. Click a source for its medium and campaign breakdown.
Source Drill-Downs
Click any source in the first-touch or last-touch lists, or any node in the page flow, to open a breakdown table of converters by source, medium, and campaign. The table sorts by any column and includes an Other roll-up row and a Total row.
Sources are grouped by their utm_source value rather than mapped into named marketing channels,
so the labels match the UTMs you tag your links with. Untagged traffic is grouped under
(direct).
When to Use This Tool
Reach for Conversion Journey Summary when you want the shape of the journeys behind a conversion: how long they took, how many touchpoints they had, and which sources and pages led into them. When you need conversion credit split across touchpoints using a specific model, use Conversion Attribution. When you want to walk paths step by step without anchoring on a conversion, use Path Explorer.
Next Steps
- Path Explorer: walk the paths visitors take, one step at a time.
- Conversion Attribution: full-journey multi-touch credit across six attribution models.
- Attribution FAQs: attribution models, date-range limits, exports, and more.
How is this guide?