

Analytics Overview
The Analytics section of Ours Privacy: Dashboards, Web Analytics, Funnels, Journeys, Insights, Path Explorer, Heatmaps, and Session Replay, built on the events you already collect and designed for HIPAA-regulated workflows.
Analytics is the section of the Ours Privacy dashboard where you read the events you already collect. Explore the same first-party events you collect for your destinations, without installing a separate analytics tracker.
The reports answer different questions, and Dashboards puts the saved ones on one page. Web Analytics covers traffic and pages. Funnels measure drop-off across steps you define. Journeys show the paths people take around the events you care about. Insights chart how often any event happens over time. Heatmaps and Session Replay show what individual visitors did on a page.
Put saved reports on one page with Dashboards, and ask the AI Assistant why a number moved.
Why Use Analytics in Ours Privacy?
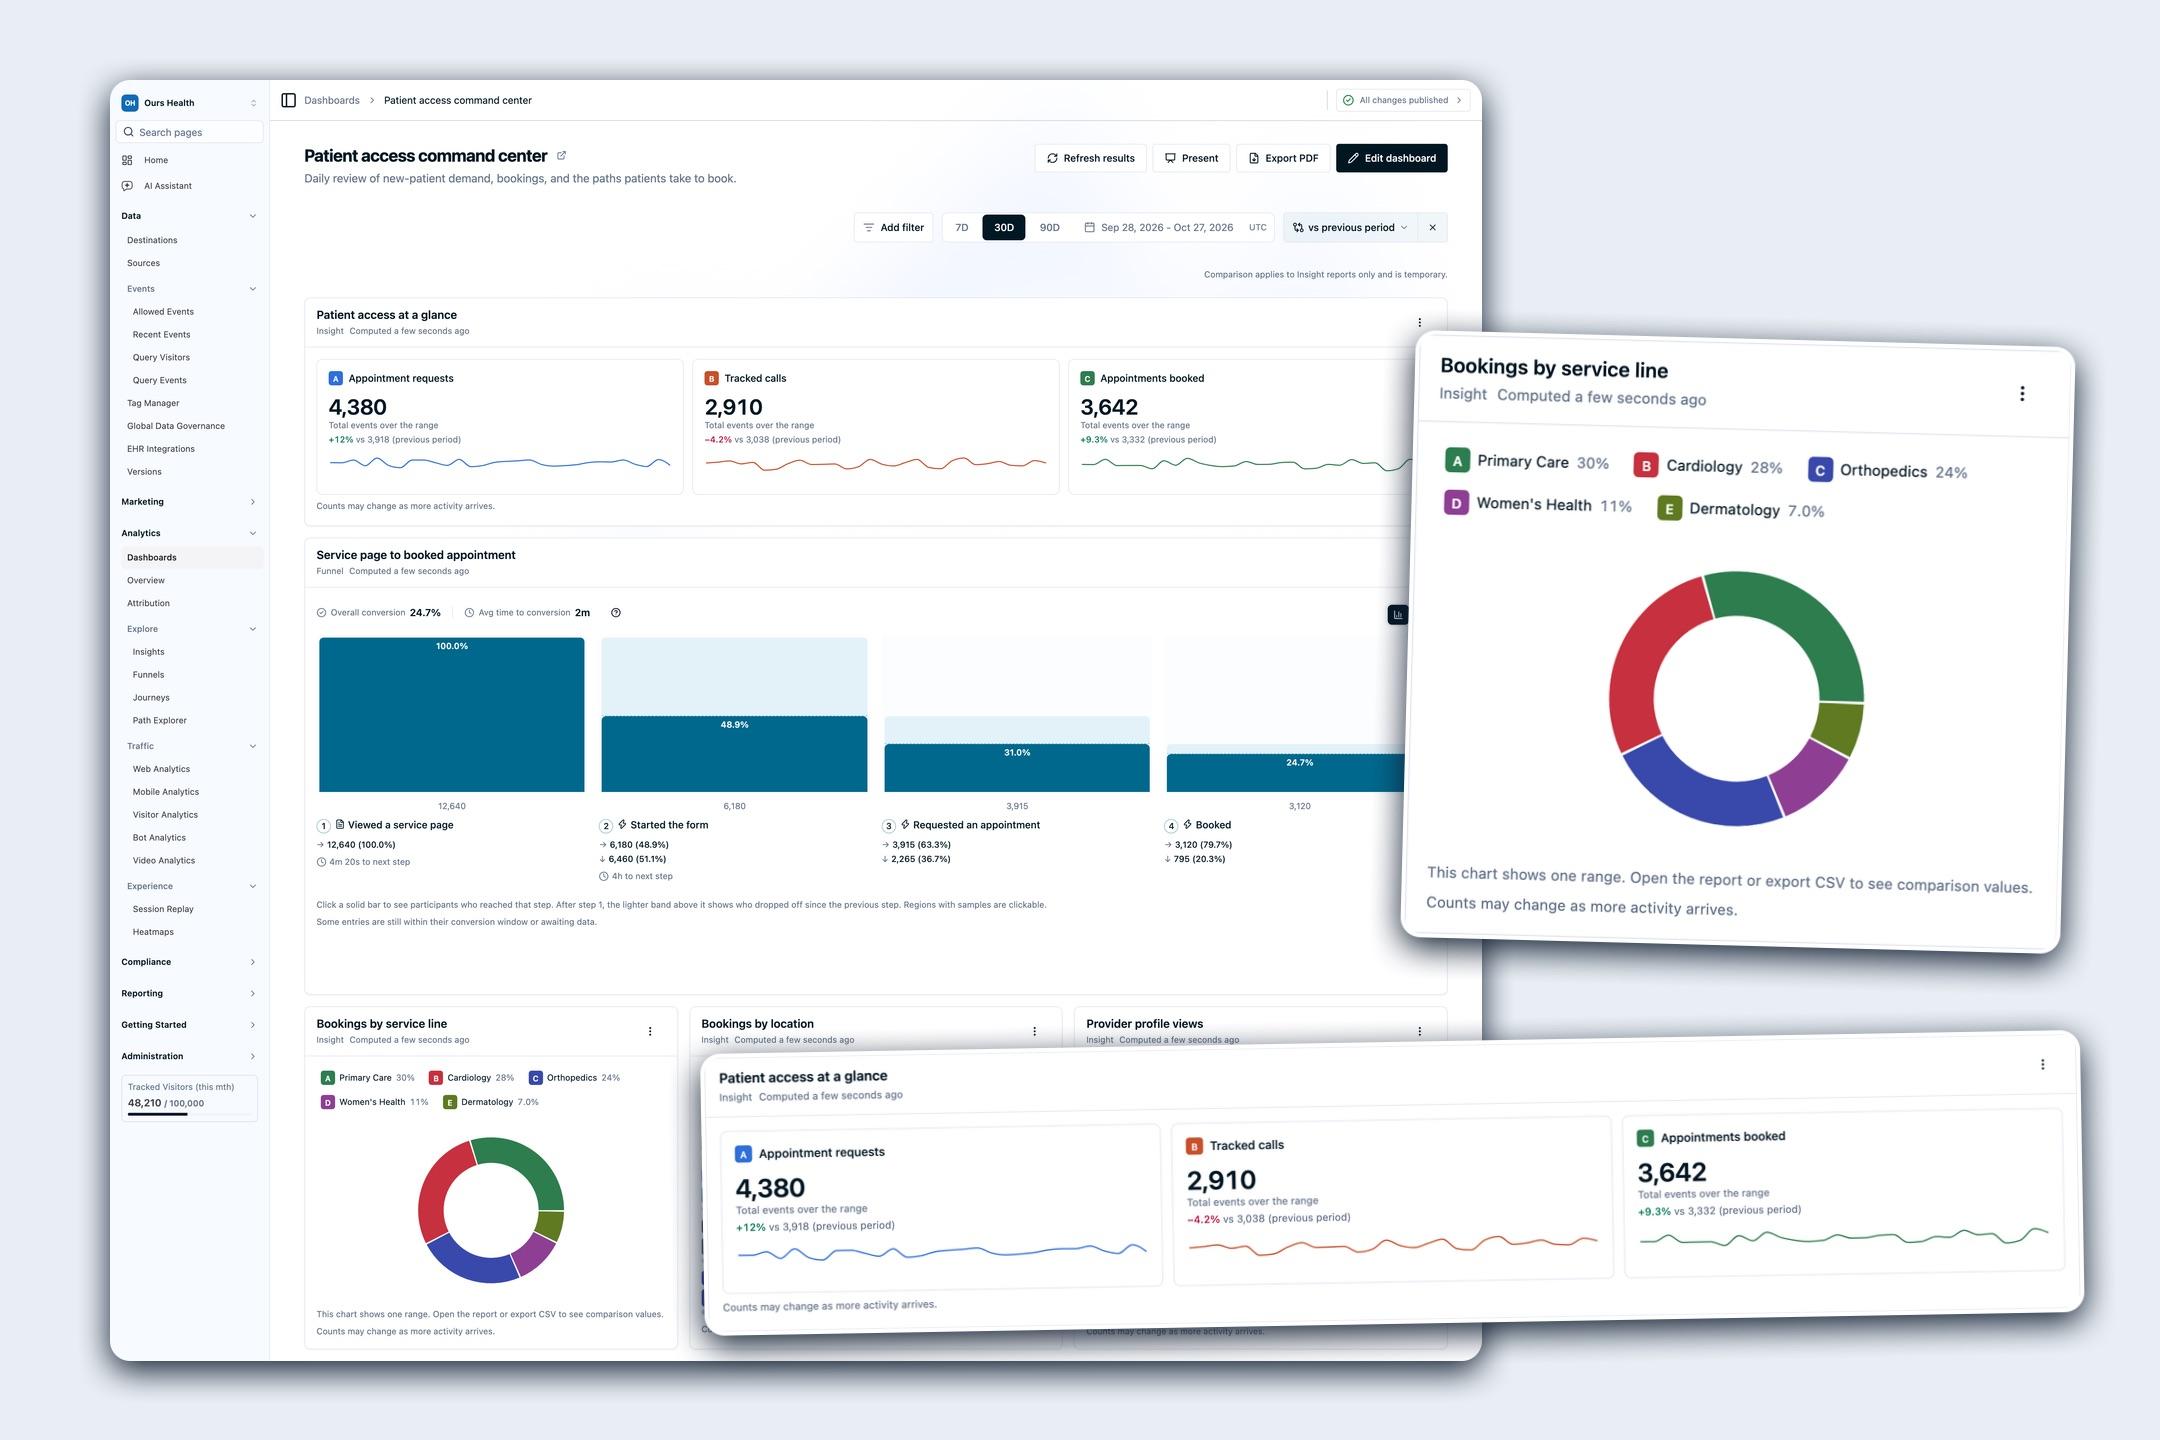
- One board for the reports your team reviews: put saved Insights, Funnels, and Journeys on one dashboard under a shared date range and filters, then share it as a branded PDF or presentation.
- One event stream, every report: website, mobile, and server events land in the same reports without a second tracking install.
- Built for HIPAA-regulated workflows: reports run inside your Ours Privacy account under your Business Associate Agreement.
- People, not just sessions: Funnels and Journeys can follow one person across visits by visitor ID.
- Consent-aware: the same consent and governance rules that gate your destinations apply to the data these reports read.
- Exports built in: PDF, CSV, and PNG exports on the reports, and REST API access for Funnels and Journeys.
Key Features
- Dashboards: up to 12 saved reports, notes, and session replay lists under one date range and filter set, with period comparison, branded PDF export, and presentation mode.
- Web Analytics: traffic, sources, campaigns, pages, and conversions for your websites.
- Funnels: conversion rate and drop-off across 2 to 10 steps, following a person across visits.
- Journeys: the paths people take before, between, and after up to 10 anchor events, as a flow diagram or a ranked list.
- Insights: how often events happen, who does them, and the sum or average of a property, charted over time with period comparison.
- Path Explorer: walk page-to-page flows one step at a time within Web Analytics.
- Heatmaps: click, scroll, and attention maps for any page.
- Session Replay: watch individual sessions, linked from Funnels and Journeys samples.
- Query Events: explore the raw event stream with filters, columns, and export.
- Query Visitors: find the people who fired an event, viewed a page, or came from a campaign, and open each visitor's profile and timeline.
- AI Assistant: ask a question about your analytics in plain language and get a previewed Insight or Journey back.
- Analytics Recipes: tile-by-tile dashboard builds for common healthcare goals.
Contact your account representative to turn on Dashboards, Funnels, Journeys, Insights, Path Explorer, and Web Analytics for your organization.
Which Report Answers Your Question?
| Question | Report |
|---|---|
| How are my service lines doing this month, all in one place? | Dashboards |
| Where do people drop out of my booking flow? | Funnels |
| What do people do before and after they book? | Journeys |
| Is this event happening more or less than last month? | Insights |
| Which page do visitors go to next? | Path Explorer |
| Which channels deserve credit for a conversion? | Conversion Attribution |
| Did this specific event reach Meta? | Query Events |
| Who requested an appointment from our flu clinic campaign last week? | Query Visitors |
| Why did this number move? | AI Assistant |
Need Help?
If you have questions about Analytics or need help choosing a report, reach out to support@oursprivacy.com.
How is this guide?