Short Link Reporting
Read the Analytics tab on an Ours Privacy short link: total and unique clicks, the daily time series, country, city, and device breakdowns, date-range limits, and bot exclusion.
Use this page to read the built-in report on a short link. Open a link from the list and select the Analytics tab.
Reporting requires the View Short Link Reporting permission. Without it, the tabs do not appear.
Performance summary
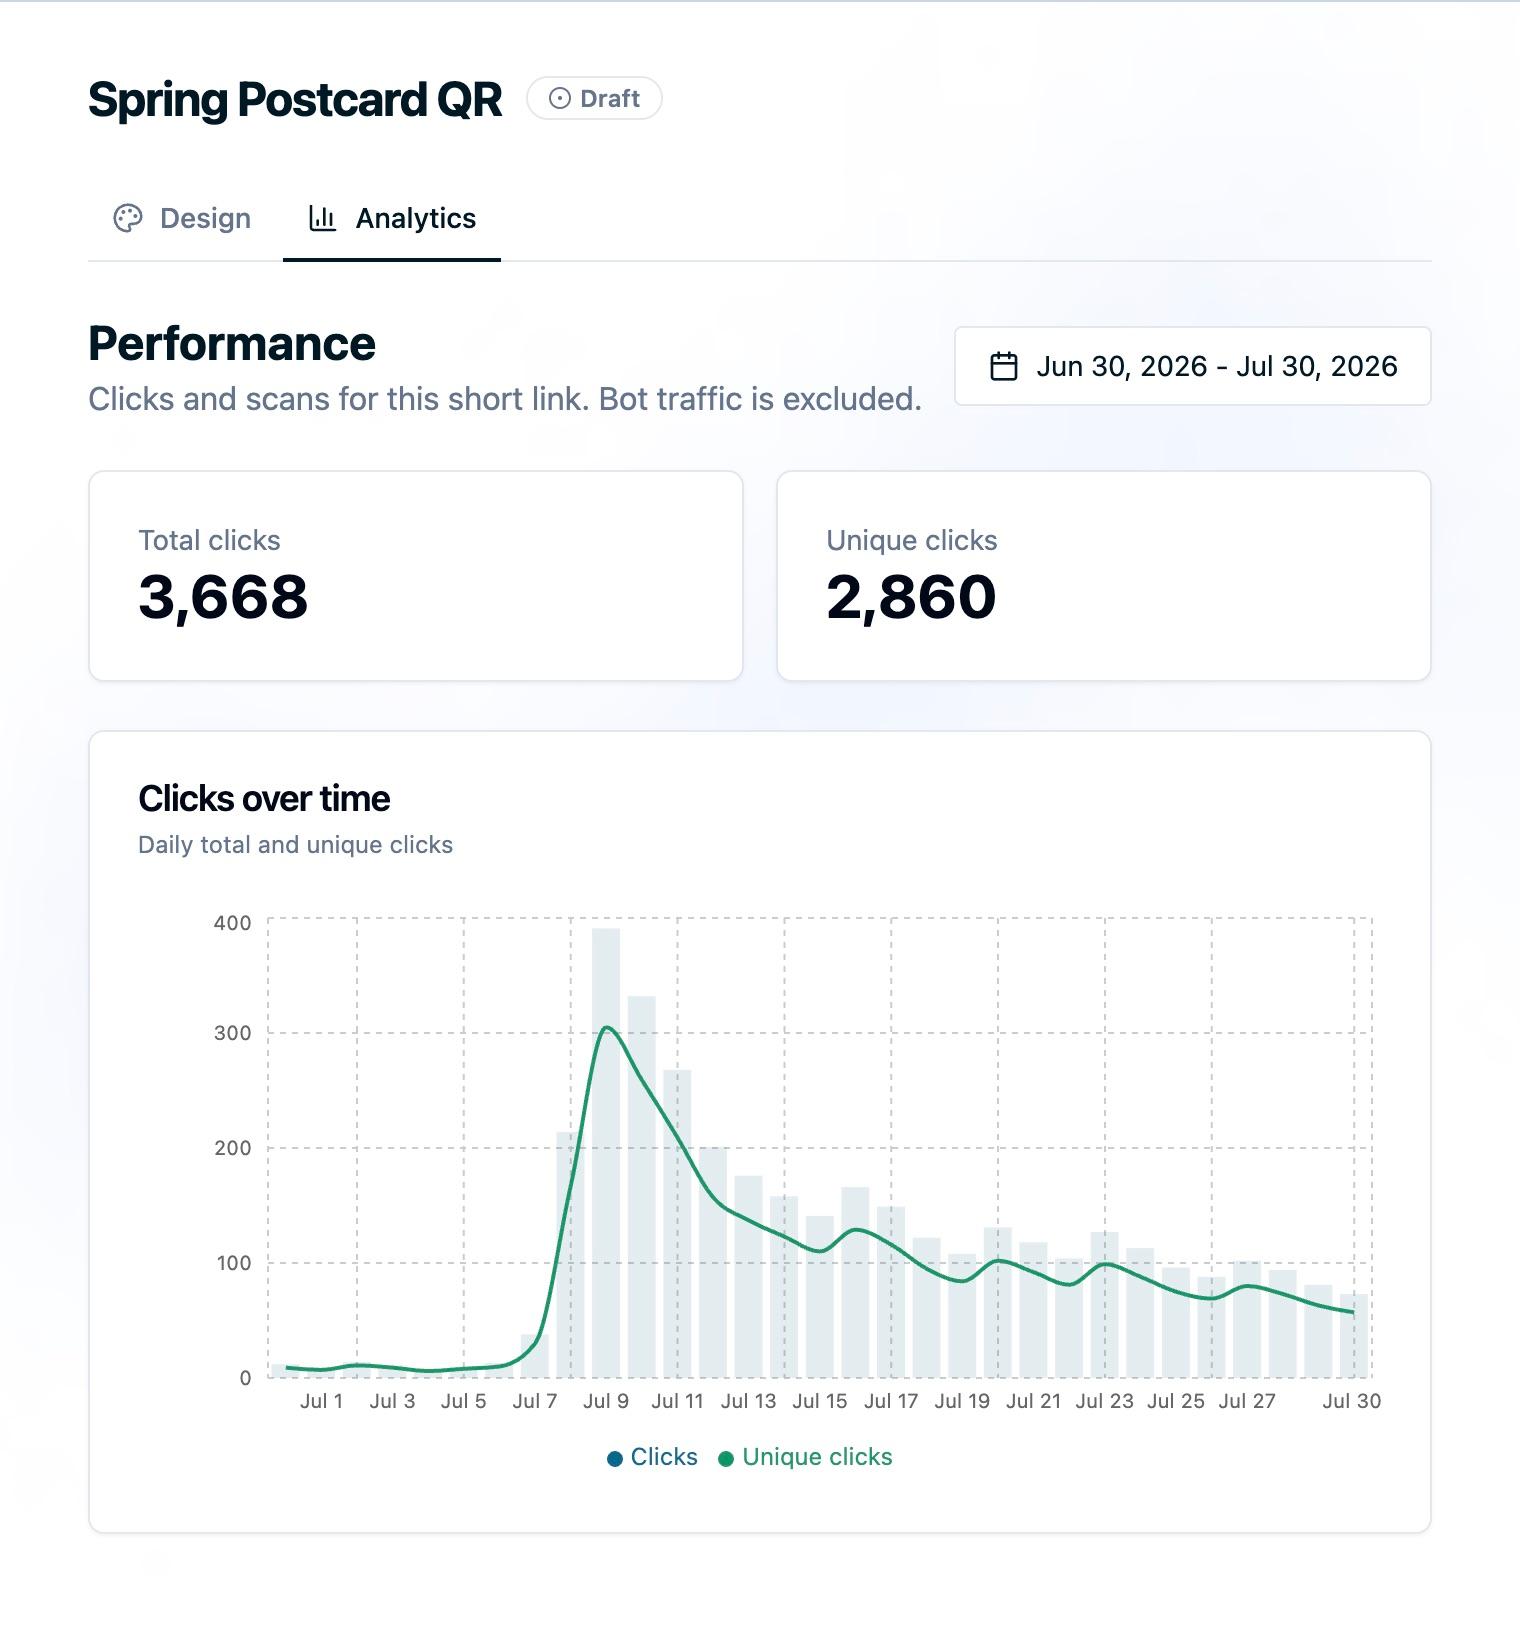
Two numbers sit at the top, both scoped to the selected date range:
- Total clicks: every scan and click recorded, after bot exclusion.
- Unique clicks: the number of distinct visitors who opened the link, after bot exclusion.
The gap between them tells you something real. A printed code in a waiting room with far more total than unique clicks is being scanned repeatedly by the same people, which usually means the landing page is not answering their question on the first visit.
Clicks over time
A daily chart combining total clicks as bars and unique clicks as a line, so you can read volume and reach on the same axis.
Use it to confirm that a campaign launched when you expected, to spot the decay curve after a mailing lands, and to identify the day a placement started or stopped working.
Breakdowns
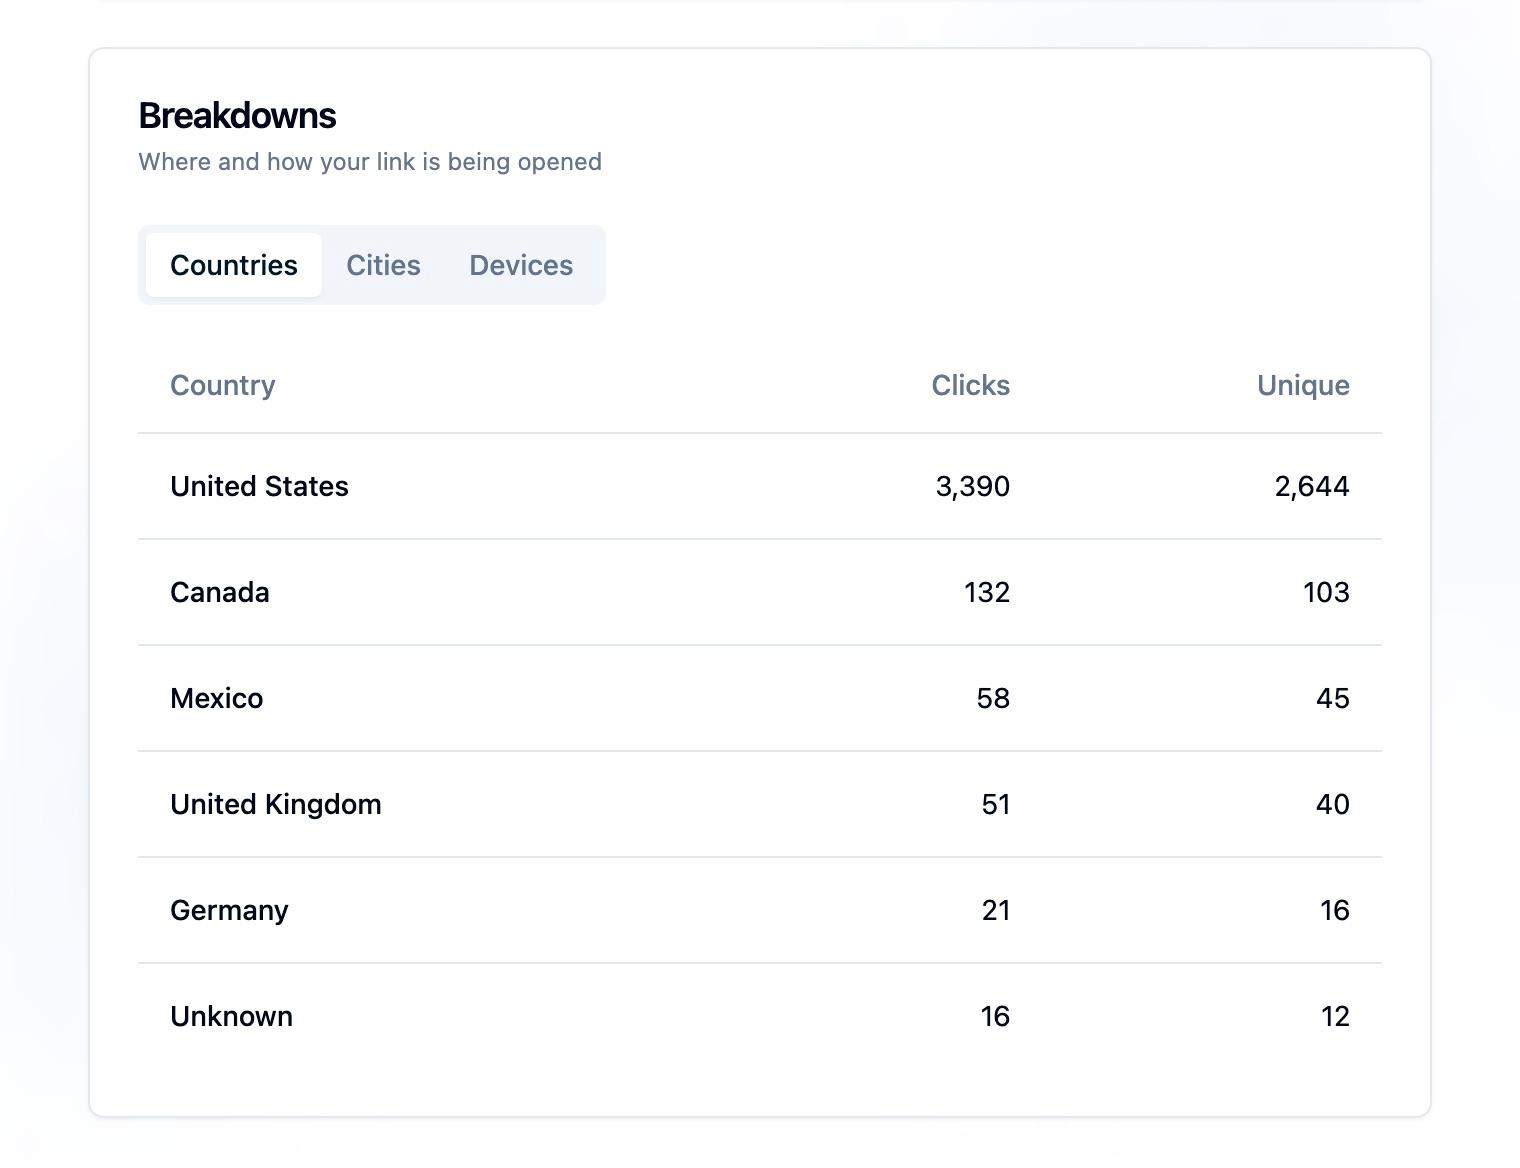
Three tabs, each a table of a dimension with Clicks and Unique columns:
- Countries: the approximate country each click came from.
- Cities: the approximate city. Useful for print and local campaigns where you know where the material was distributed.
- Devices:
mobile,tablet,desktop, orunknown.
Values that could not be determined appear as Unknown. Each breakdown returns the top 100 rows by click volume.
The device split is the fastest sanity check on a QR campaign. A printed code should be overwhelmingly mobile. A large desktop share on a code that only exists on a poster means the URL is circulating some other way.
Date range
The date picker defaults to the last 30 days and allows a window of up to 90 days.
For longer ranges, or for hourly granularity, use the Platform API, which supports up to 92 days of daily data or 31 days of hourly data in a single request.
Scans are counted as clicks
The QR code encodes the same URL as the Copy link button, so there is no way to tell a camera scan apart from a click. Reporting counts them together, and the subtitle on the page says so.
Two workarounds when the split matters:
- Create two links for the same destination, one named for the printed code and one for the digital placement, and give them different campaign content values.
- Read the device breakdown, which approximates the split for campaigns where the printed material is mobile-only by nature.
Bots are excluded by default
Automated traffic is filtered out of the numbers on this page. Link previewers in messaging apps and email security scanners follow redirects and would otherwise inflate every count, sometimes substantially for email placements.
The underlying events are still in your account. An ad-hoc query in Web Analytics that does not filter on the bot flag will show a higher total than this page. That is the expected difference, not a discrepancy.
Campaign roll-up
The Analytics tab reports one link at a time. To read a whole campaign together:
- Web Analytics: filter on the campaign property to combine every link that shares a campaign value.
- Platform API: request a report for a campaign value directly. See Automating short links.
What the report does not include
- Referrer. Not captured on the redirect path. Use one link per placement instead.
- Browser or operating system breakdown. Those properties are on the event, so break them down in Web Analytics rather than here.
- A top-links leaderboard. Reporting is per link.
- Conversion or revenue columns. Because the click is a normal event on the visitor timeline, measure conversion in Attribution or a funnel rather than here.
Next Steps
- Short link click events: every property behind these numbers.
- Automating short links: pull the same report through the API.
- Recipes: measurement setups that combine short links with funnels and audiences.
How is this guide?