

Attribution Reports
Save attribution reports in Ours Privacy that credit leads, bookings, and revenue to the channels, sources, campaigns, and terms that drove them, compare six attribution models, see what moved, and open the visitors behind any number.
Use attribution reports to see which channels and campaigns earn the credit for the outcomes you care about: leads, appointment requests, booked appointments, and the revenue behind them. One report holds several outcomes side by side, reads them under any of six attribution models, calls out what moved since the last period, and opens the visitors behind every number.
Open Attribution in appContact your account representative to turn on attribution reports for your organization.
Open a report
Open Attribution from the Analytics section of the left navigation. The page lists your organization's saved reports with their outcomes and when they were last updated. Select a report to open it, or select New report to build one. Legacy reports opens the Attribution Center views.
Build a report
A new report starts with a blank name and one empty outcome. Name each outcome and choose its events to preview the results, then add more outcomes as needed.
- Name the report, and optionally describe what it measures and how to read it. The description appears under Report definition in the report header.
- For each outcome, give it a name and pick the events that count. Add more than one event when several actions mean the same thing, such as a lead form or a tracked call. Add up to five outcomes; each is counted on its own, so use Funnels when the order of steps matters.
- Narrow an outcome with Condition, such as
service_lineiscardiology. Use Every outcome to apply a condition to all of them at once. - Select Value on an outcome to credit revenue as well as conversions, and pick the event property that holds the amount.
- Choose a Lookback window (how far before a conversion a visit can earn credit) and a Currency for valued outcomes.
- Select Save report.
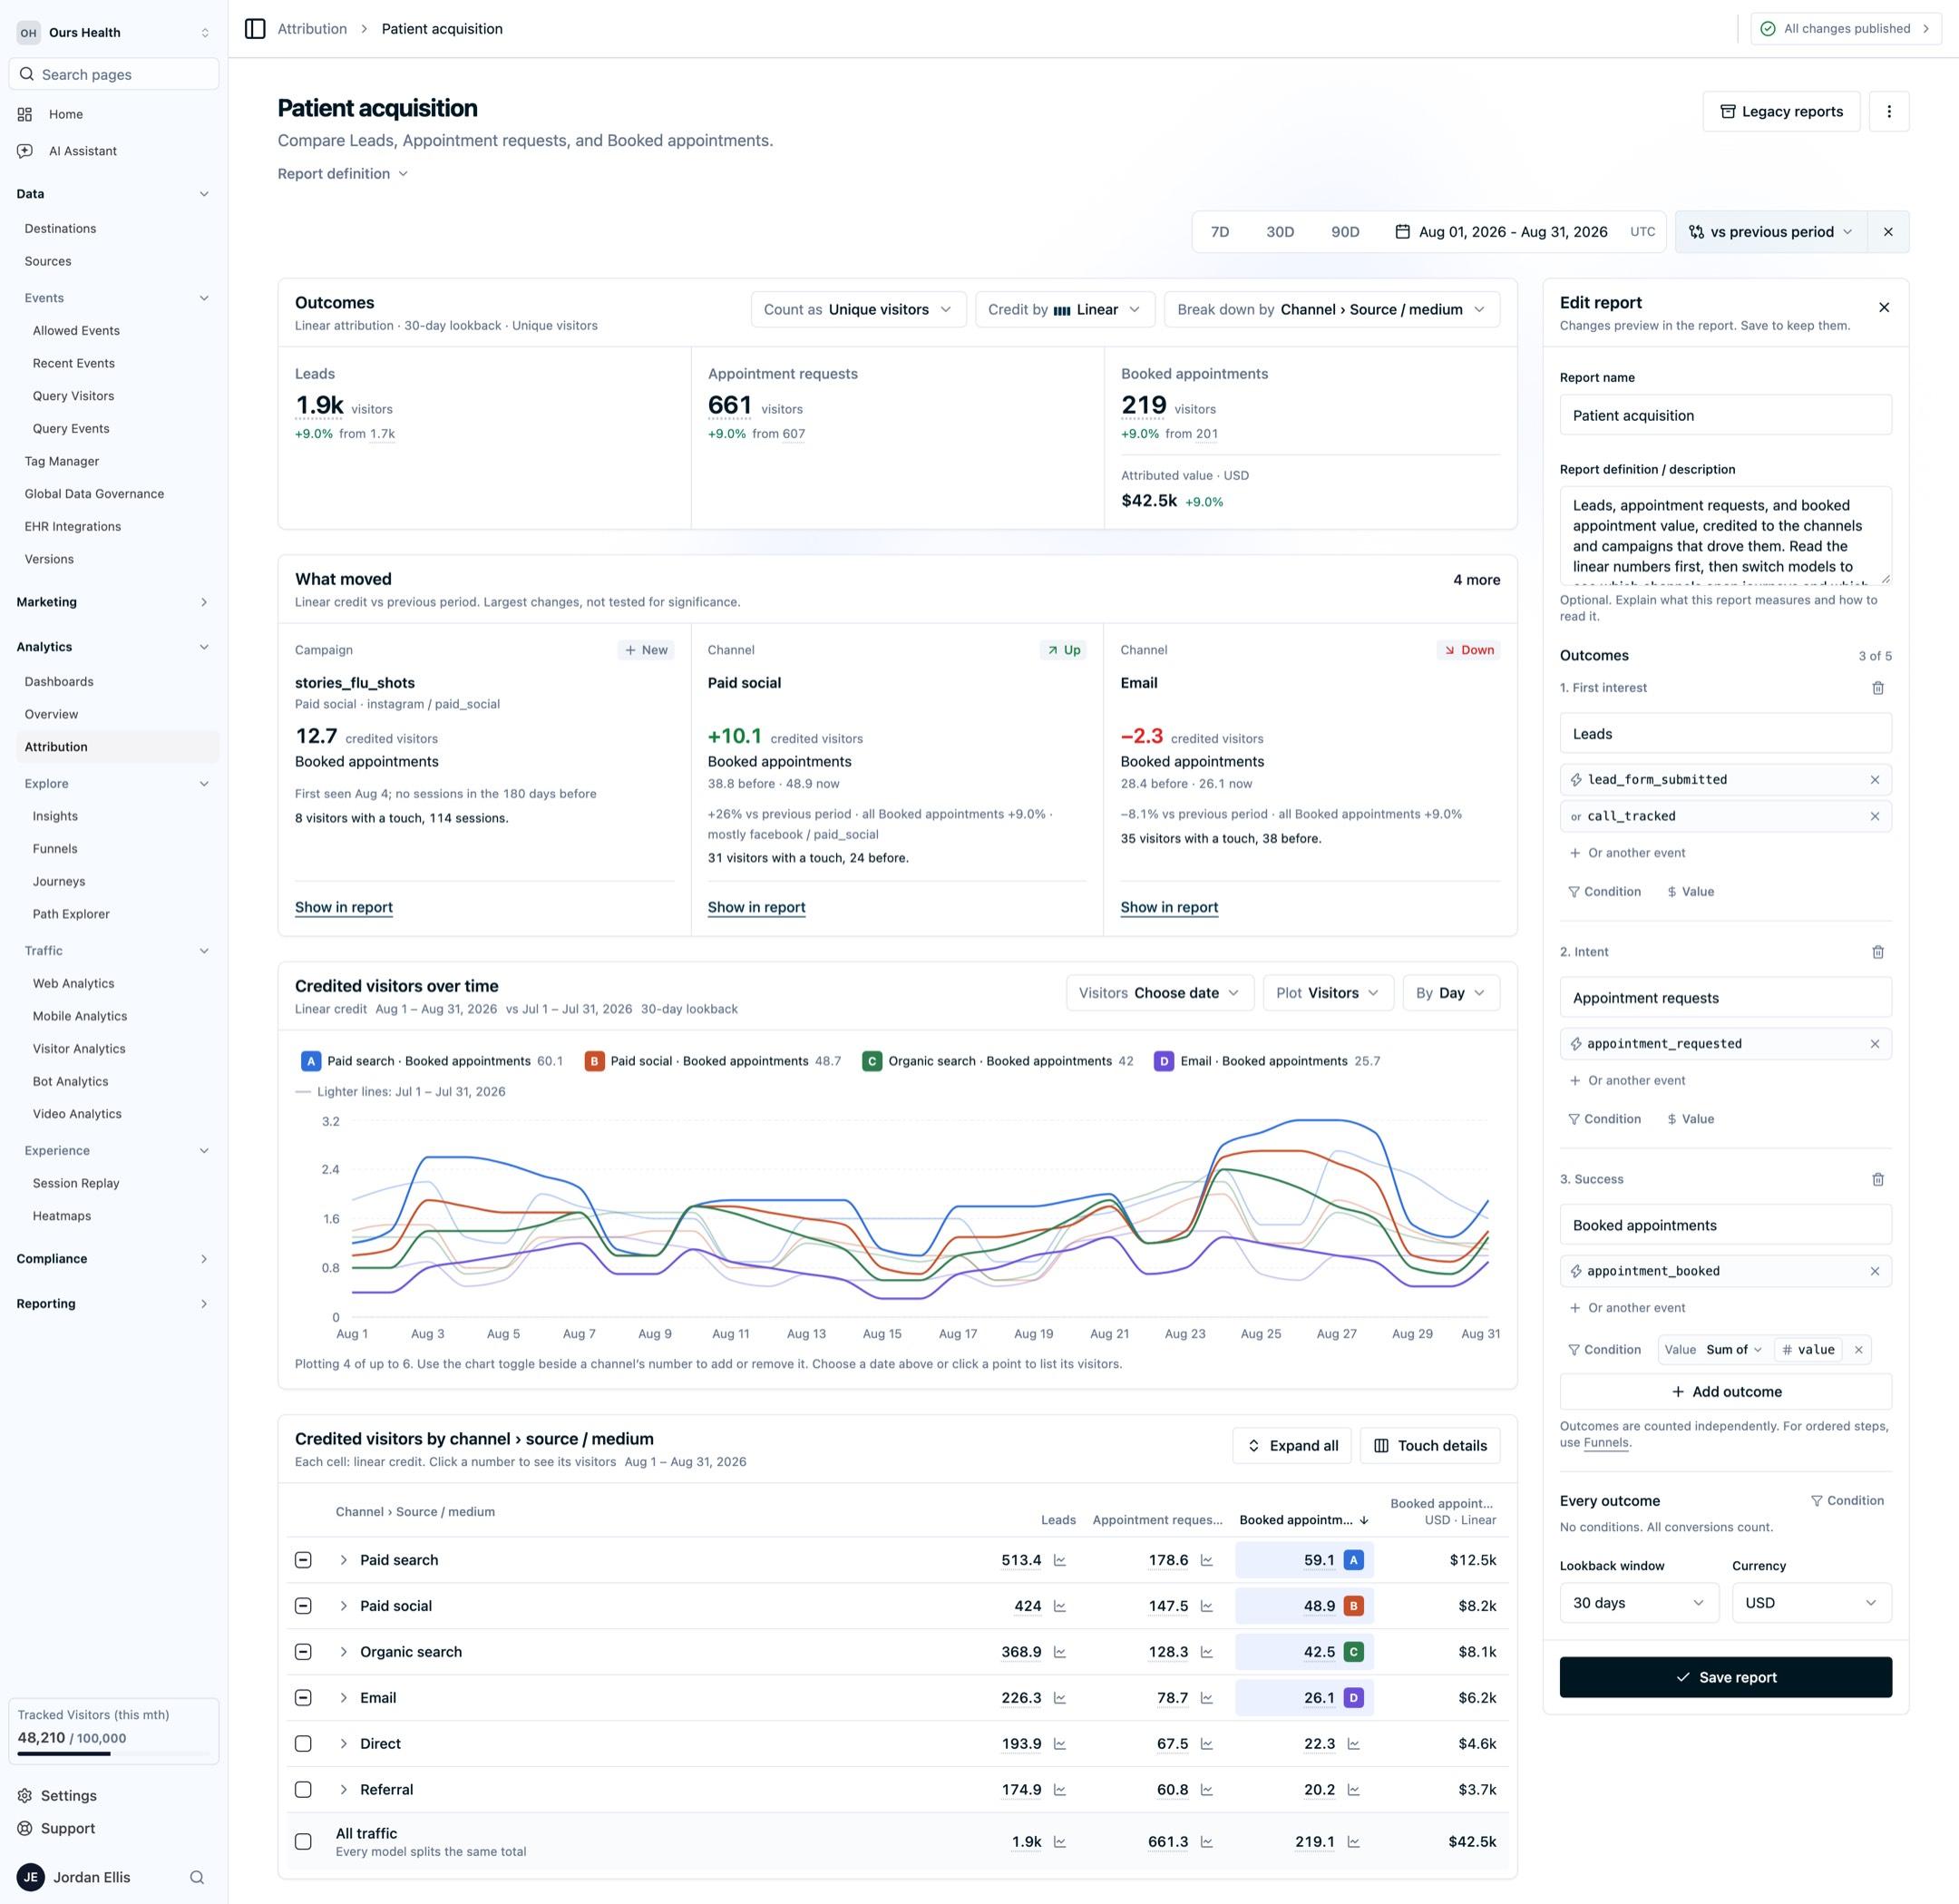
To change a saved report, select Edit report. Changes preview in the results right away, and a bar at the bottom of the page lets you save or reset them. If a teammate saves the same report while you are editing, your edits stay put and you can save them as a separate copy. Duplicate and Delete are in the report's menu.
Read the results
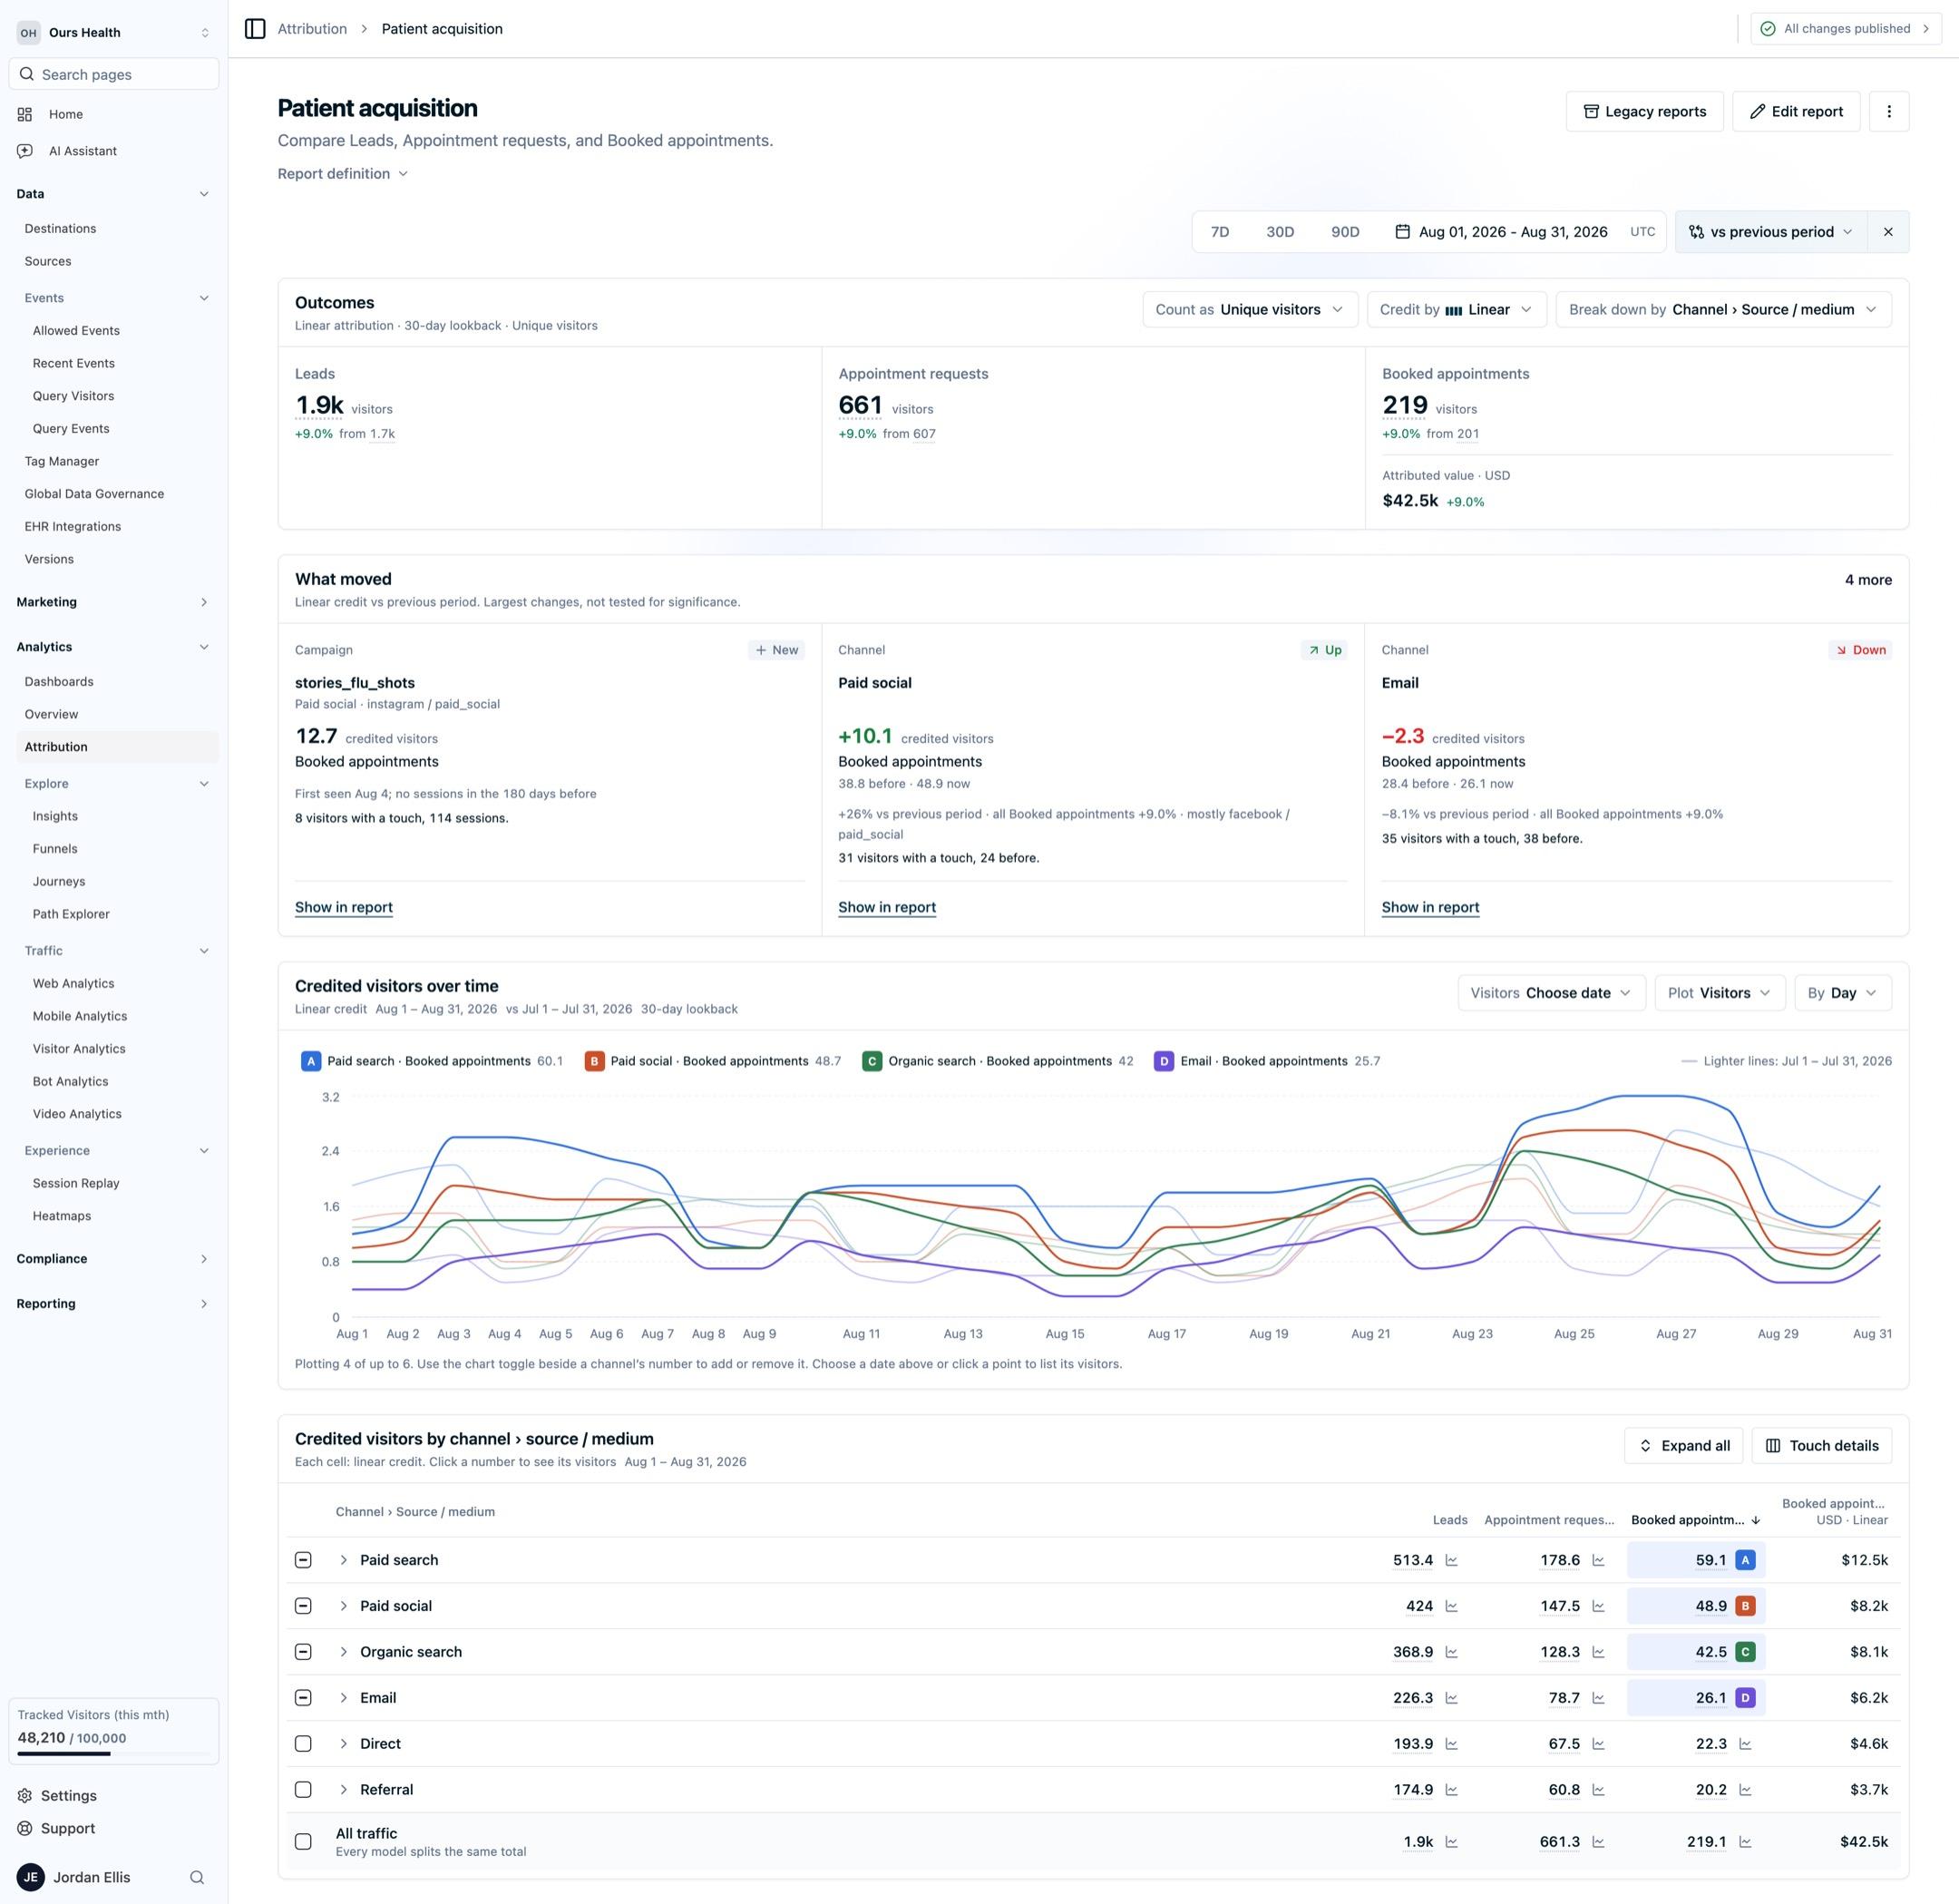
The controls above the results change how the report reads:
- Date range and comparison. A comparison (previous period by default) adds the change on every total and powers What moved. The date range is saved with the report; the comparison is not.
- Count as: Unique visitors counts each converting visitor once, Sessions counts each converting session once, and Total conversions counts every conversion.
- Credit by: First touch, Last touch, Linear, U-shaped, J-shaped, or Time decay. Every model splits the same total, so switching models moves credit between channels without changing the outcome totals. How each model splits credit works through the differences.
- Break down by: channel, then source / medium, campaign, and term, as deep as you want to read.
Outcomes
Each outcome shows its total for the range, the change from the comparison period, and its attributed value when it has one. Select a total to see the visitors behind it.
What moved
What moved surfaces the changes worth a look before you read the table: sources, campaigns, and terms that are new and already earning credit, the channels that rose or fell the most against the comparison period, channels that first-touch and last-touch credit very differently, and rows that went quiet. Each finding shows its before and after, so a large percentage on a small base reads for what it is. Select Show in report to expand the table to that row and plot it on the chart.
Credited over time
The chart plots credit by day or week for the rows you choose. Use the chart toggle beside any number in the table to add or remove a series, and Plot to switch between credited conversions and credited value. The lighter lines show the comparison period.
Breakdown table
The table credits every outcome to each channel, and expands into source / medium, campaign, and term. Touch details adds first-touch and last-touch credit next to the model's number in every cell. Sort by any outcome from its column header.
Channels are assigned from each visit's UTM source and medium, falling back to the referrer for untagged visits: Paid social, Paid search, Display, Paid other, AI assistants, SMS, Email, Affiliate, Organic social, Organic search, Referral, and Direct.
See the visitors behind a number
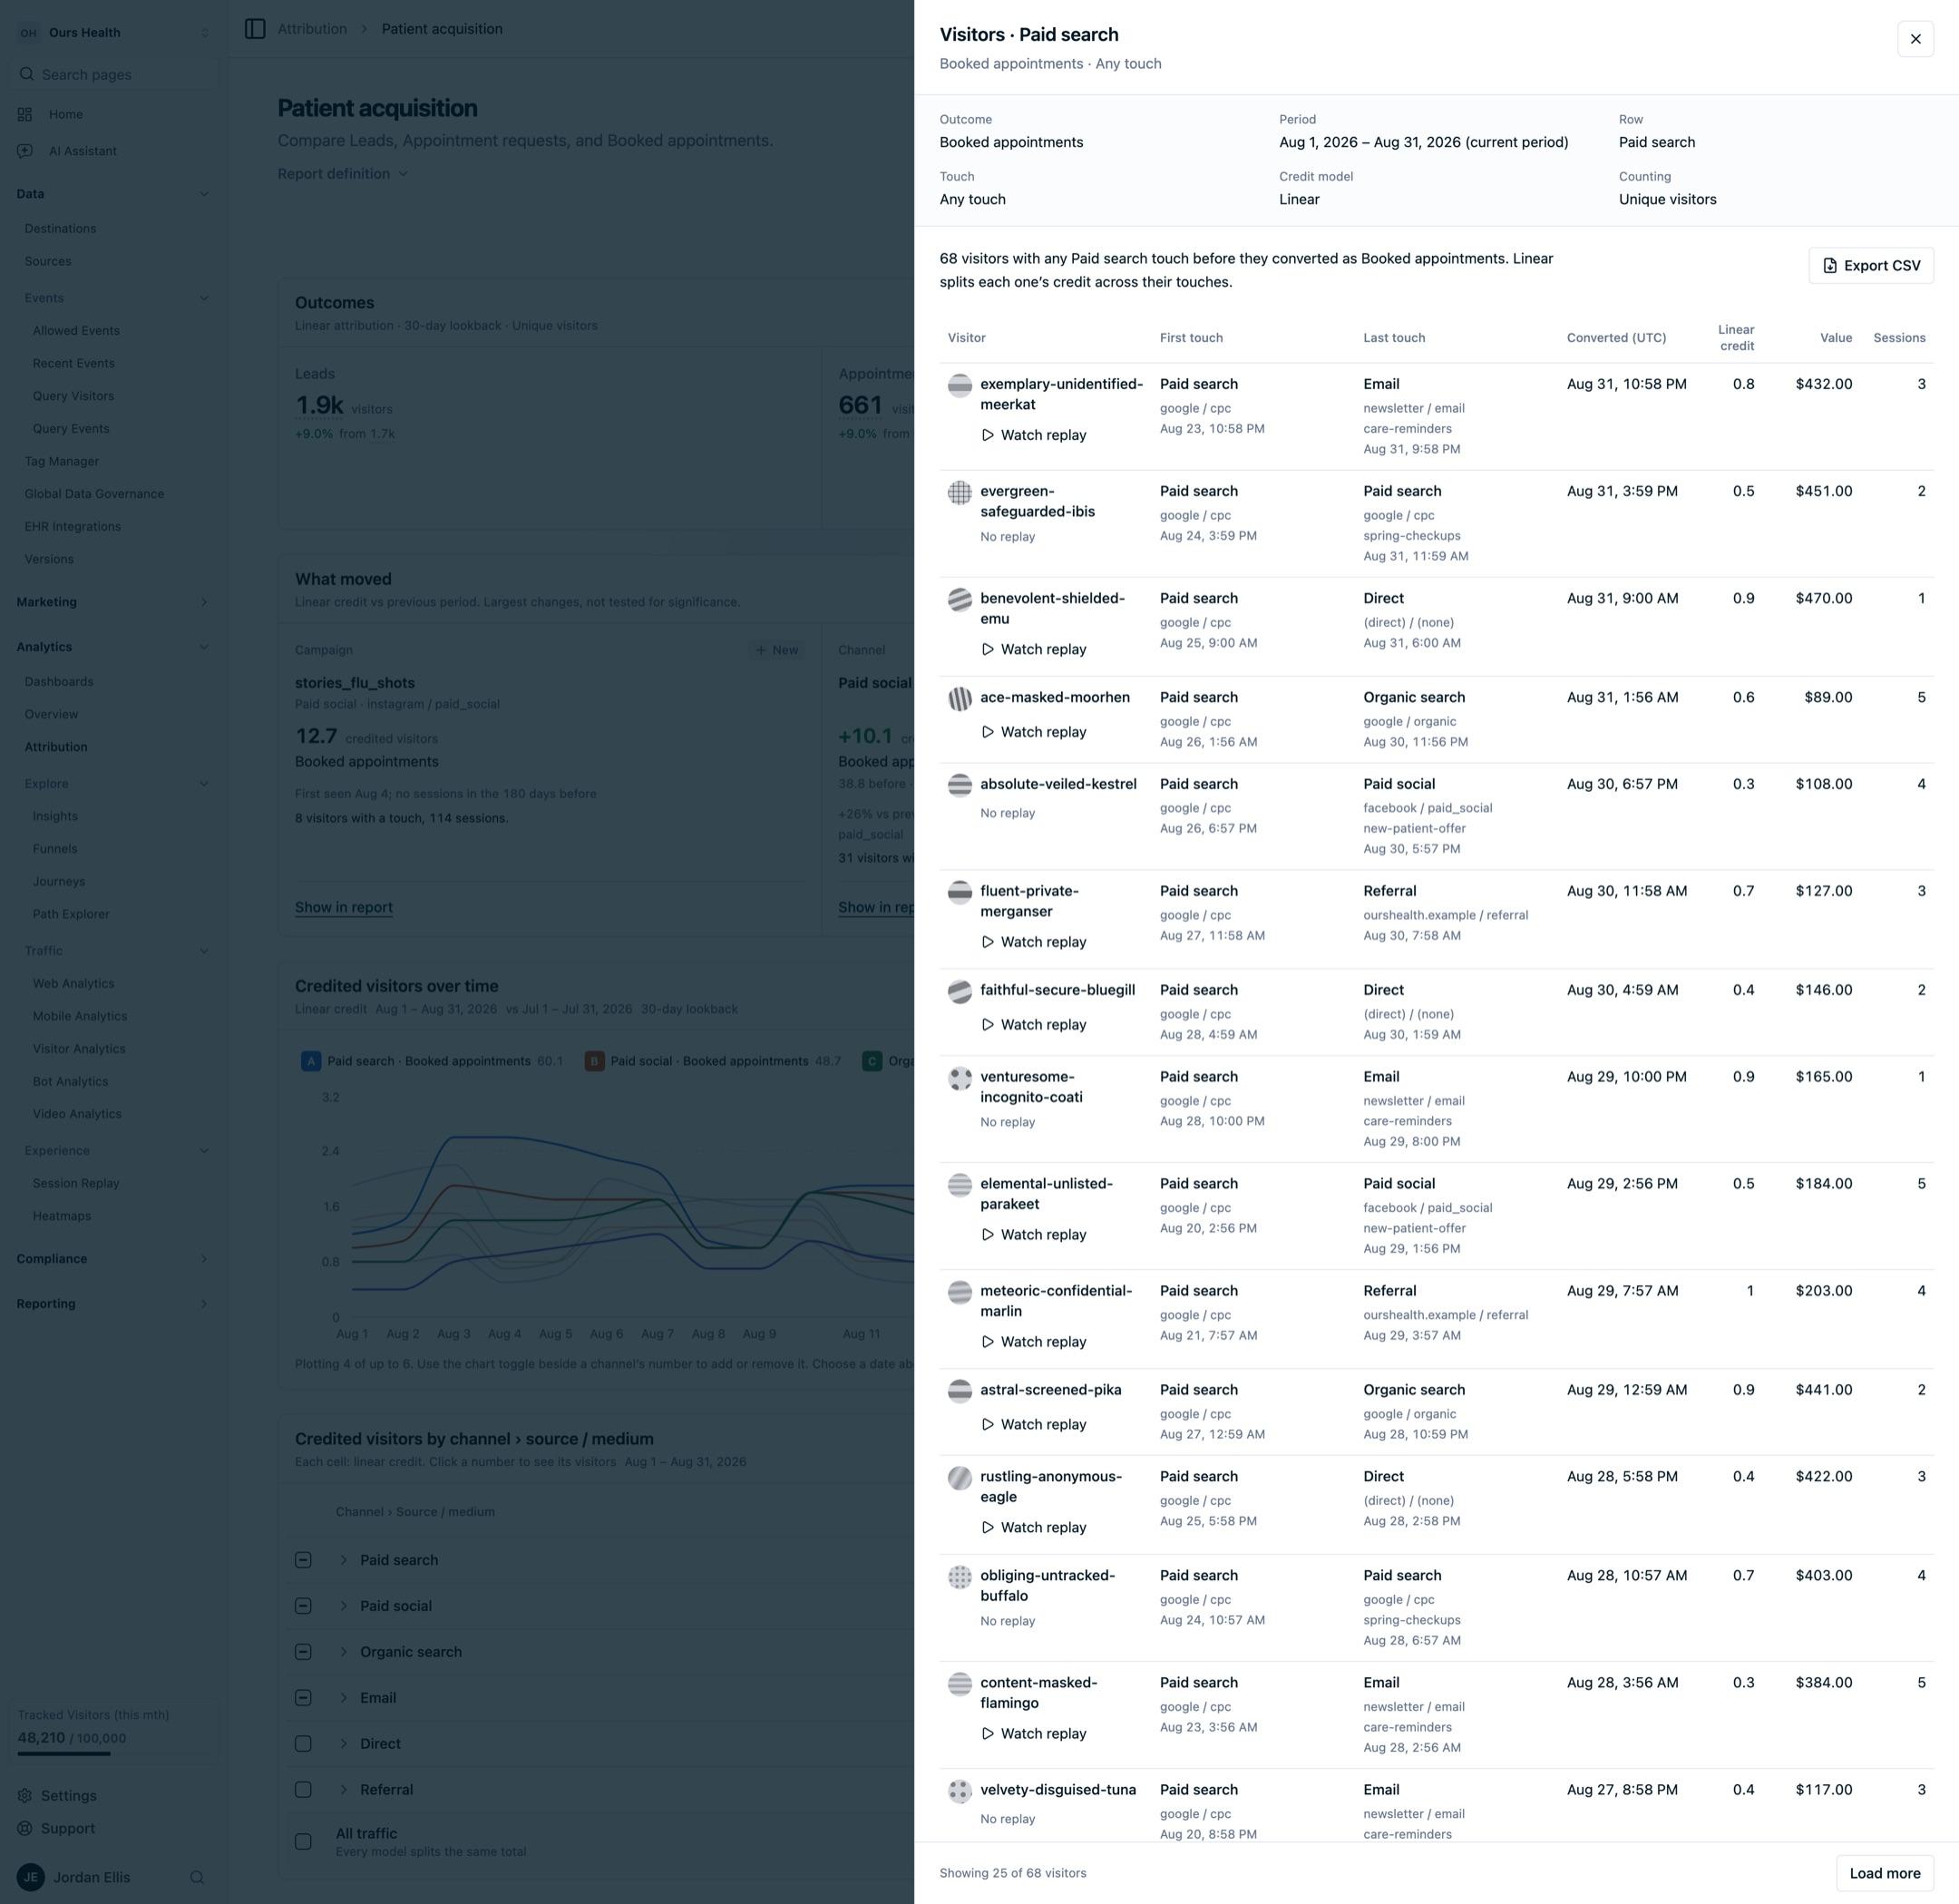
Select any number in the outcomes, the table, or a point on the chart to open the visitors behind it. The panel restates what you selected (outcome, period, row, touch, model, and counting), and its total matches the number you clicked. Each visitor shows their credited first and last touch, when they converted, their credit and value, and how many sessions they had. Open a visitor's profile, select Watch replay to see what they did, or select Export CSV to download the full list.
Next Steps
- Attribution Overview: pick the right attribution view for your question.
- How each model splits credit: a worked example of all six models on one journey.
- Visitor Identity and Matching: how touches from one person are connected across devices.
- Attribution Reports API: manage reports and read results programmatically.
How is this guide?