

Pages & Content
Analyze which pages visitors view, enter on, and exit from, view every page on your site, and drill from a page into individual session replays.
Pages & Content
Use this page to understand how individual pages perform: what visitors view most, where they land, and where they leave. The Pages section has three view modes, each answering a different question.
Three Ways to Look at Pages
Switch between views using the dropdown at the top of the Pages section.
Top Pages
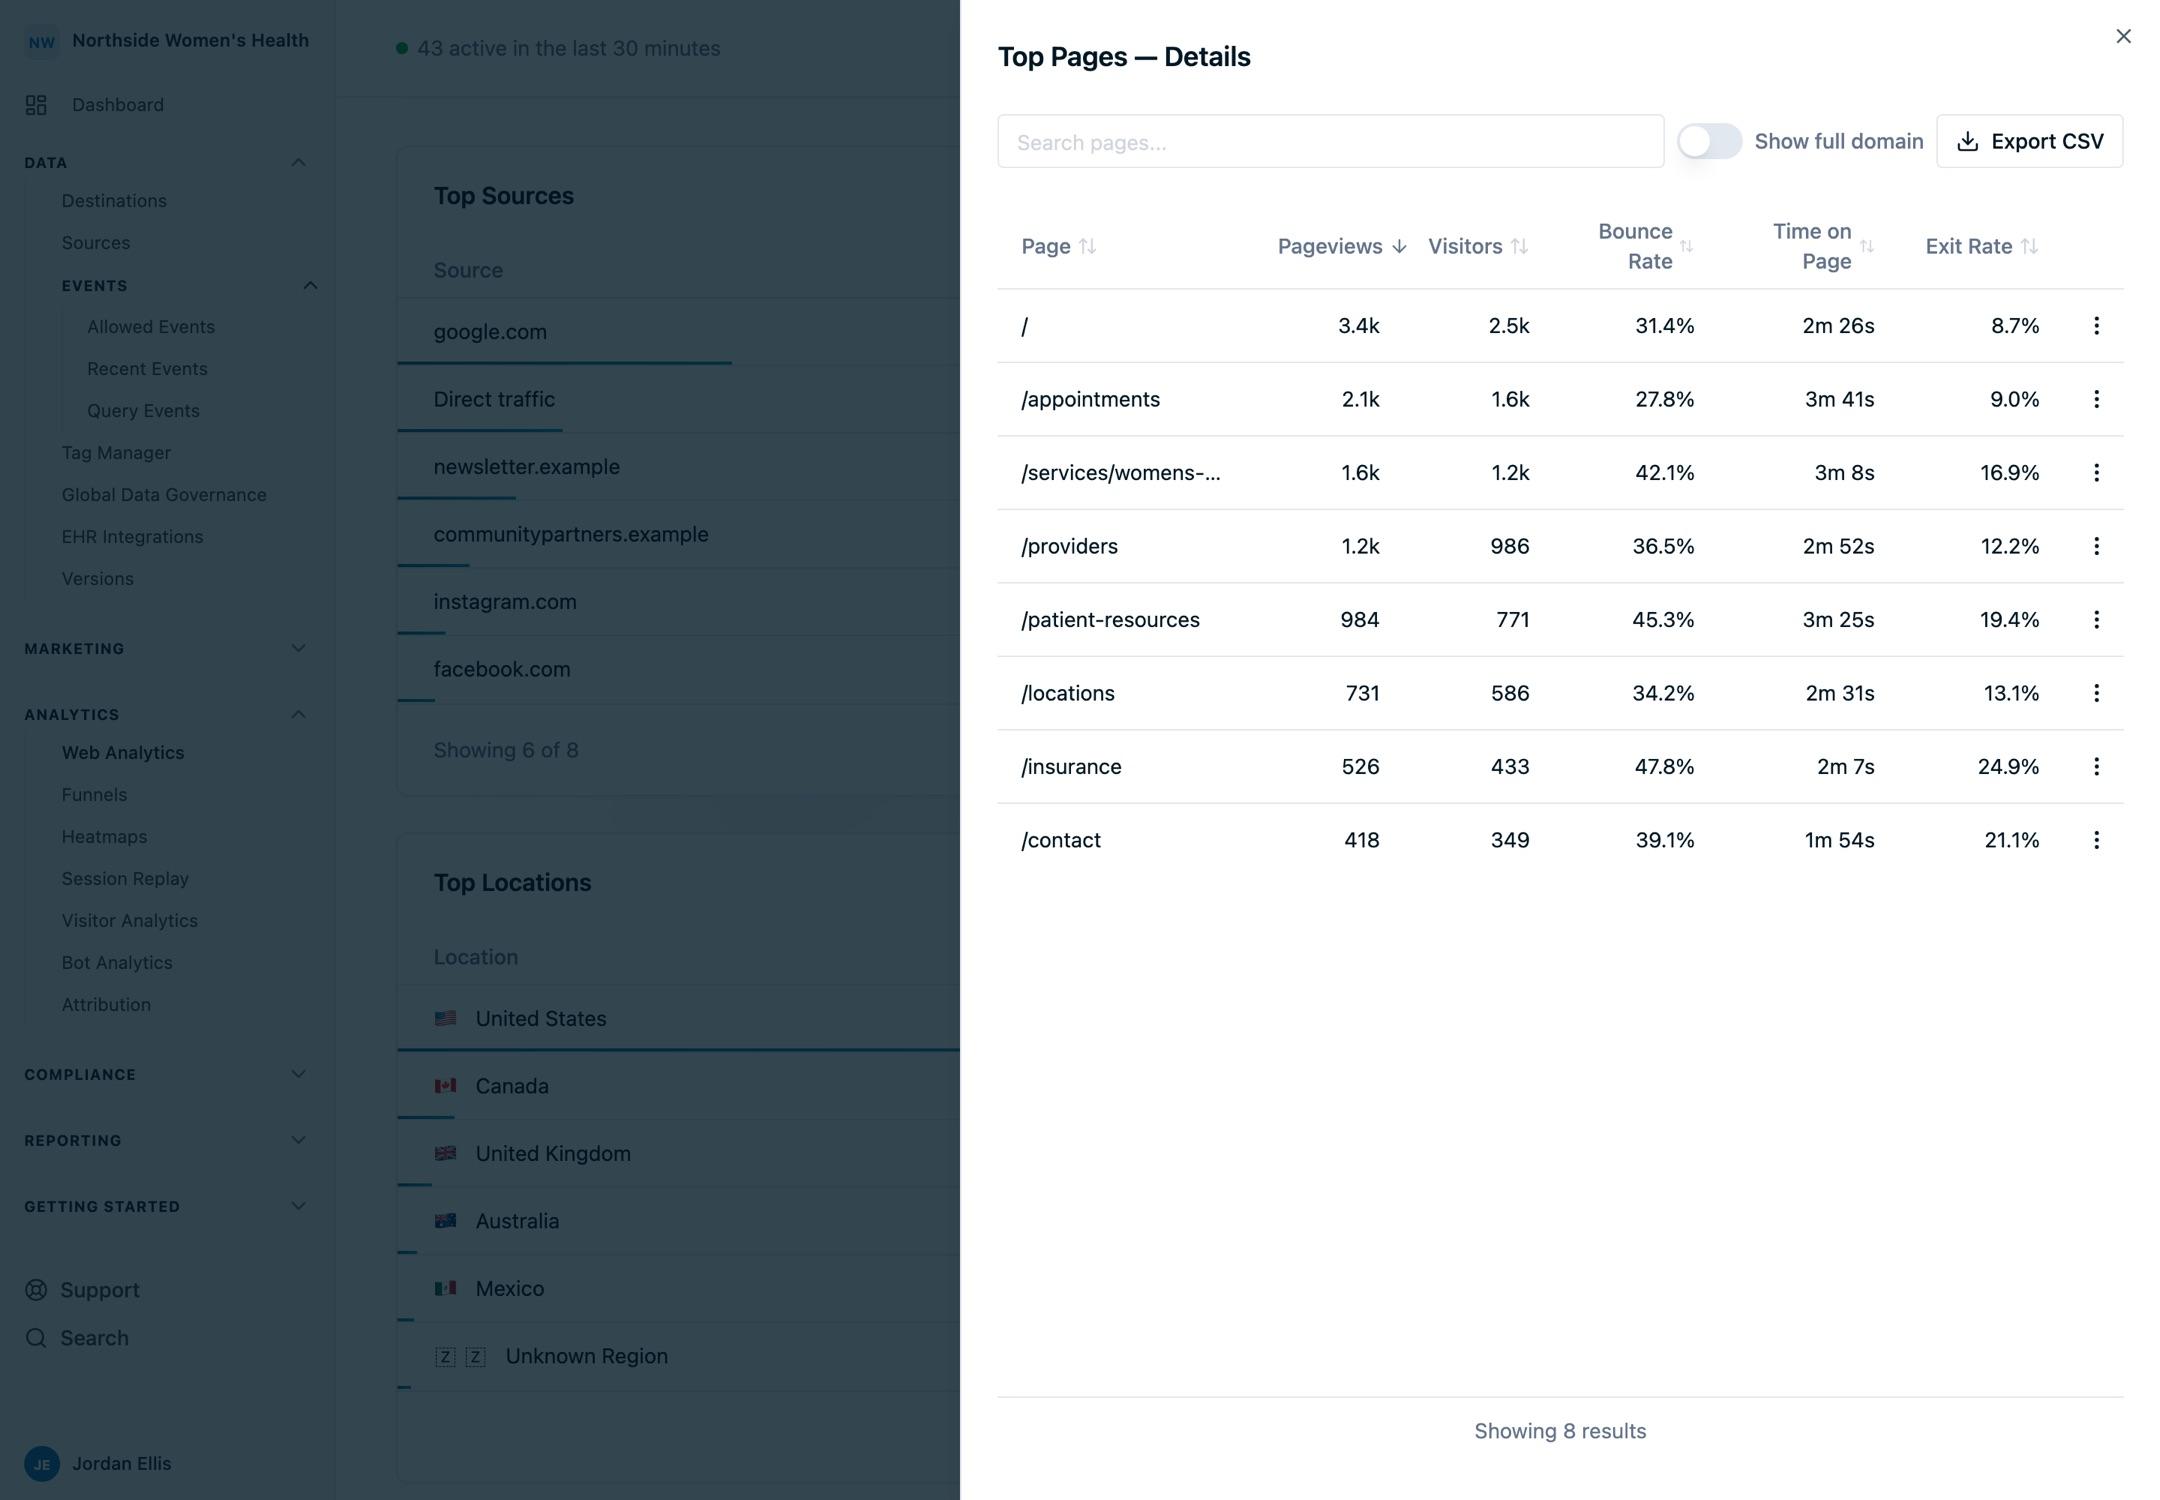
The most-viewed pages on your site, with pageviews, unique visitors, bounce rate, time on page, exits, and exit rate. Use this to find your highest-traffic content and see how well it holds attention.
Entry Pages
The pages where sessions begin — the first page a visitor sees. Shows entries, unique visitors, bounce rate, and visit duration. Use this to understand which pages attract new sessions from search, ads, and direct links, and how effectively they pull visitors deeper.
Exit Pages
The pages where sessions end — the last page before a visitor leaves. Shows exits and exit rate (exits as a percentage of that page's total pageviews). Use this to spot where visitors drop off.
For exactly how each metric is calculated, see the Metrics Glossary.
See Every Page
The dashboard summary shows the top results, but you're not limited to them. Click View Details on any view mode to open the full paginated table covering all pages — not just the top entries — with column sorting, text search, and CSV export.
This matters for large sites: a page that never cracks the top ten can still be searched, sorted, and exported from the detail view.
Drill From a Page Into Session Replays
If session replay is enabled for your account, open any page's detail view and you'll find a Session replays card listing that page's most recent recordings, newest first. Each row shows the visitor, how long the session ran, and how many pages and events it covered. Click Watch on a row to see that visitor move through the page, or View all sessions to open the full list filtered to it — turning a number like a high exit rate into something you can actually see.
Pages also connect to the rest of the analytics suite: from a page you can jump into heatmaps to see where visitors click and scroll on it.
Common Use Cases
- Diagnose a high exit rate. Sort Exit Pages by exit rate, then open session replays for the worst offenders to see what makes visitors leave.
- Improve a landing page. Use Entry Pages to find where campaigns land visitors, then check bounce rate and visit duration to judge whether the page delivers.
- Find underperforming high-traffic pages. In Top Pages, look for pages with many views but short time on page — high reach, low engagement.
- Audit a specific URL. Open the detail view and search for the path to pull its full metrics, even if it's far down the list.
Limitations
- Time on page can't be measured for the last page in a session. With no next pageview to compare against, the final page's time on page is excluded from the calculation.
- Exit rate is not the same as bounce rate. Exit rate is the share of a page's views that ended the session; bounce rate measures single-page sessions. A page can have a high exit rate without being a bounce.
- Client-side route changes count as pageviews. In single-page apps, each route change the SDK tracks is one pageview.
FAQ
What's the difference between entries and pageviews?
Entries count only the sessions that started on a page. Pageviews count every view of that page, including mid-session and repeat views.
Why does a page have more pageviews than unique visitors?
Because one visitor can view the same page multiple times in the selected period. Unique visitors counts the people; pageviews counts the views.
Can I see a page broken down by device or country?
Yes — apply a Device or Country filter and the Pages section updates to that segment. See Filtering & Exporting Data.
Next Steps
- Sources & Campaigns: see which channels drive traffic to these pages
- Filtering & Exporting Data: narrow pages to a segment and export the table
- Session Replay: watch how visitors actually use a page
- Heatmaps: see where visitors click and scroll on a page
Need Help?
Reach out to support@oursprivacy.com if you have questions about page metrics or drilling into session replays.
How is this guide?