

Filtering & Exporting Data
Filter your Ours Privacy web analytics dashboard by page, source, location, or device. Include or exclude values with "is" / "is not," select multiple values per dimension, then export results as CSV files or a PDF snapshot.
Filtering & Exporting Data
Use filters to narrow your analytics view to a specific segment of traffic, then export the results as CSV or PDF.
Filtering Your Data
Filters let you focus on a specific slice of your traffic. For example, mobile visitors from a particular campaign, or sessions that landed on a specific page.
Adding a Filter
There are two ways to add a filter:
- Click a row in any breakdown table or detail drawer. This sets that dimension's filter to the single value you clicked.
- Use the filter bar in the toolbar. Click the filter icon, select a dimension, choose an operator (
is,is not,contains, orexcludes), and pick one or more values. You can type a value that isn't in the suggestions: useful for long-tail URLs, referrers, and campaigns.
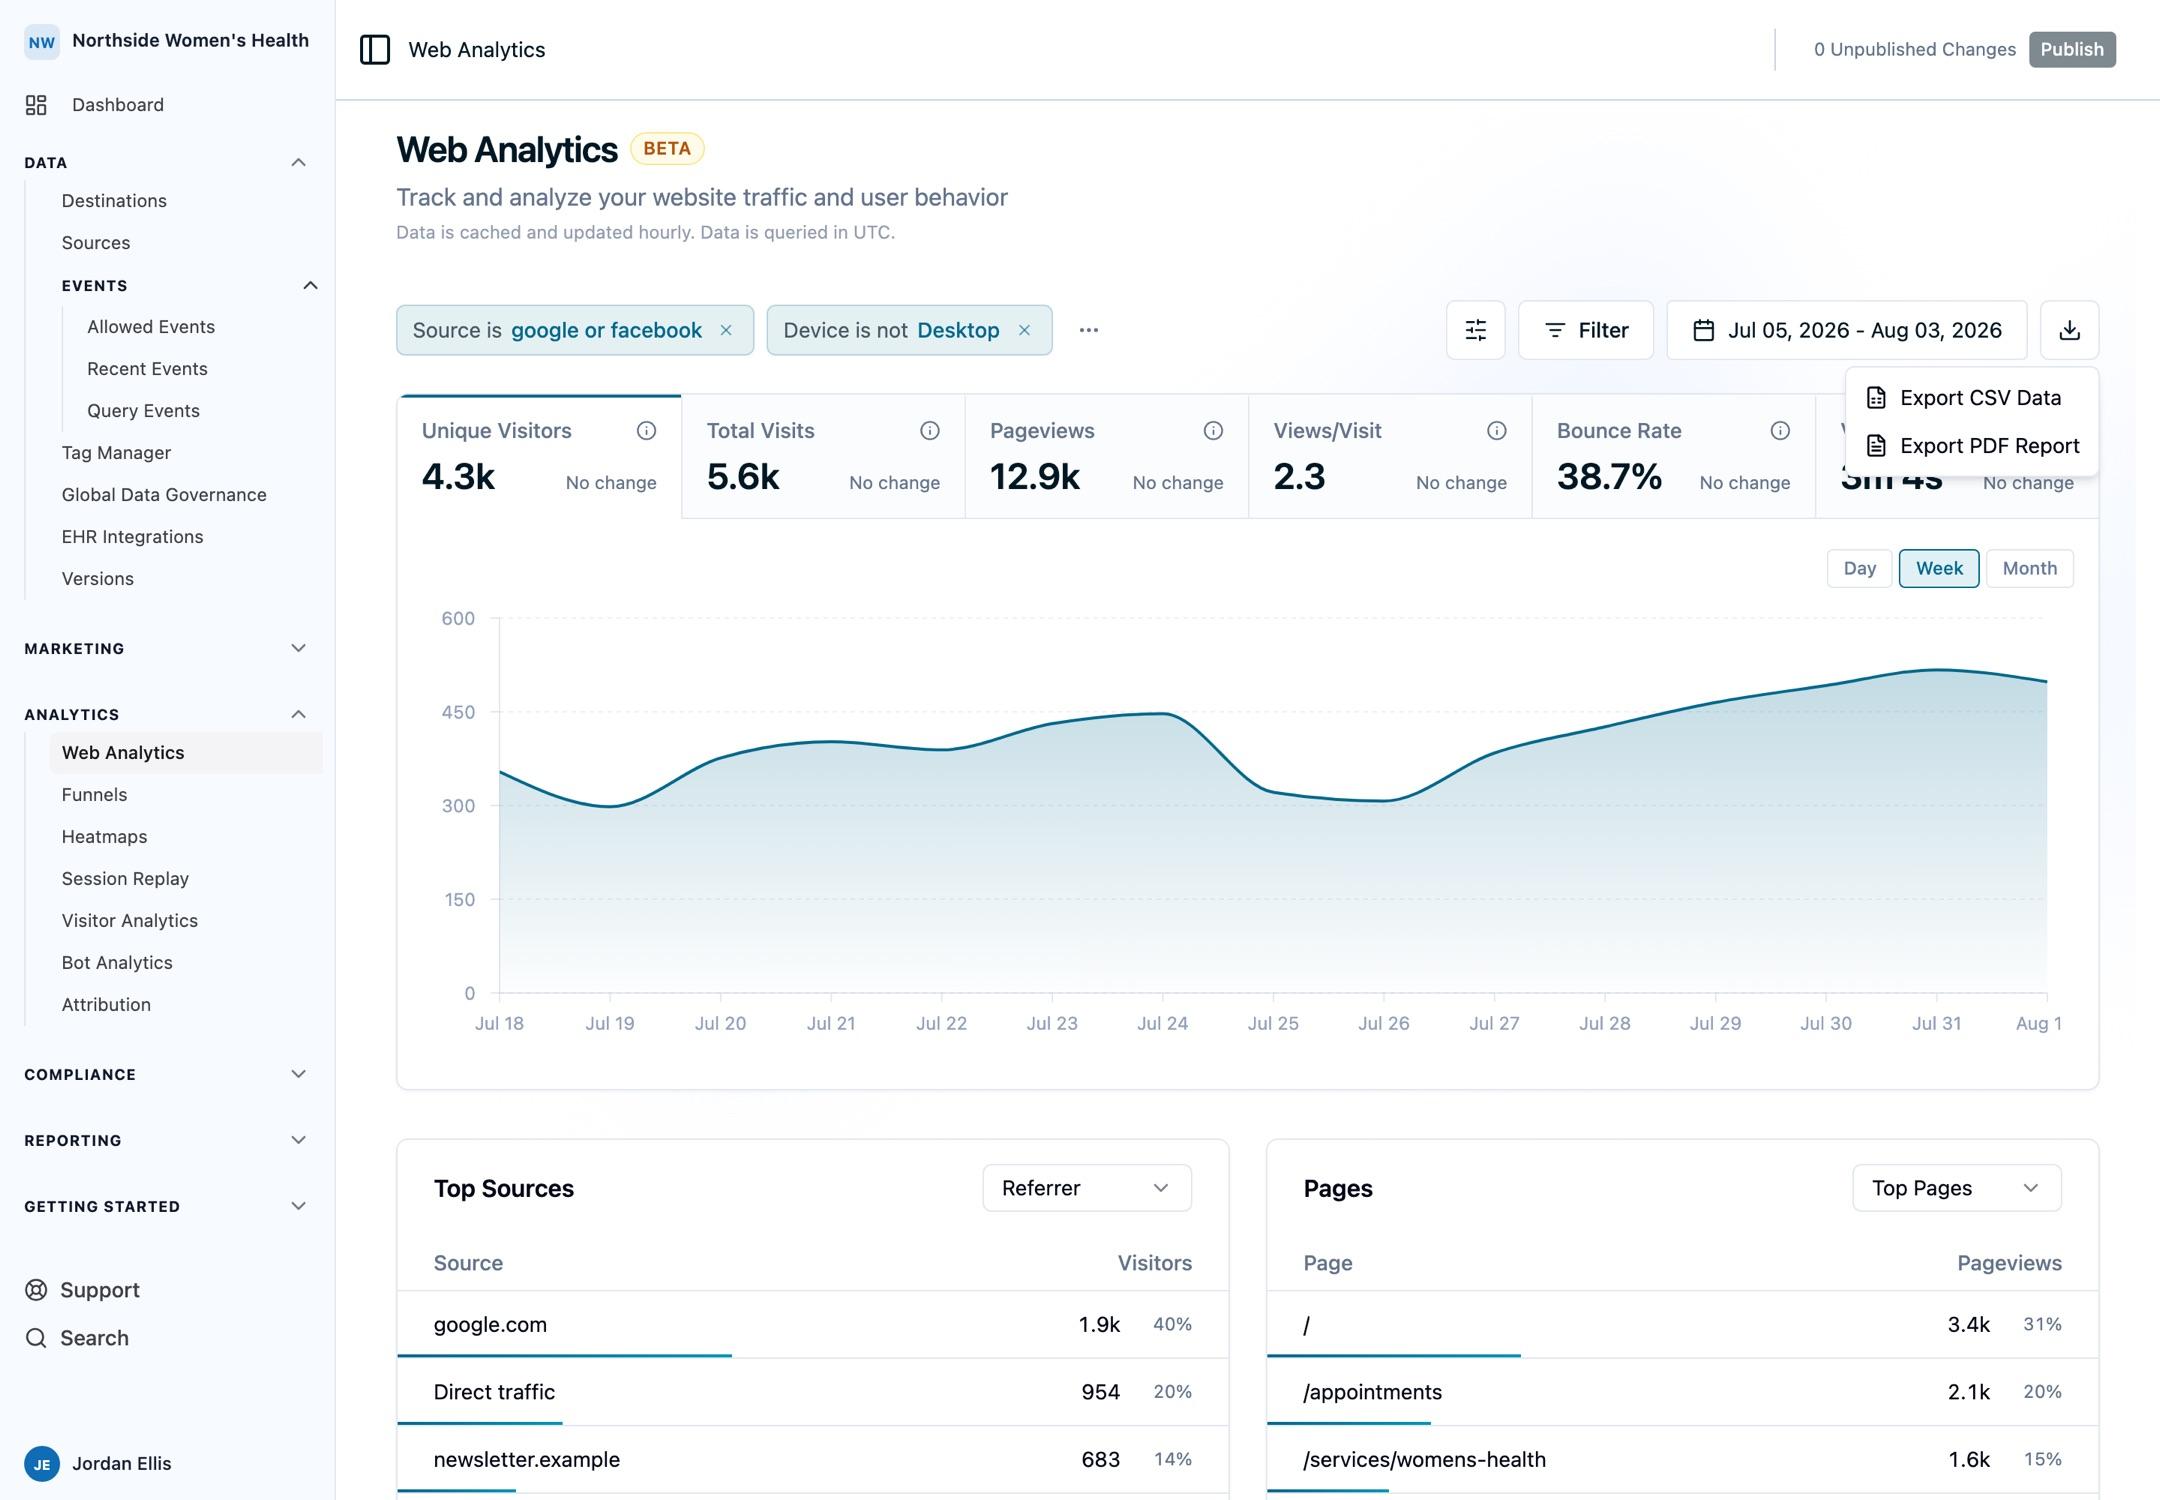
Available Filter Dimensions
| Category | Dimensions |
|---|---|
| URL | Page, Entry Page, Exit Page |
| Acquisition | Source, Medium, Campaign, Content, Term, Referrer |
| Location | Country, Region, City |
| Device | Device, Browser, OS |
Operators and multiple values
Each dimension filter has an operator and one or more values:
iskeeps traffic that exactly matches any of the selected values.is notexcludes traffic that exactly matches any of the selected values.containskeeps traffic where the dimension includes any of your values as a substring — for exampleReferrer contains newslettermatchesnewsletter.example.comandgo.acme.com/newsletteralike.excludesremoves traffic where the dimension includes any of your values as a substring (the negation ofcontains).
Within a single dimension, multiple values combine with OR: Source is google or facebook matches traffic from either. Across dimensions, filters combine with AND — add Device is mobile to the example and the dashboard shows mobile visitors whose source is google or facebook.
To add a second value, open the filter bar, click the dimension, and select another value (or type one and press Enter). To exclude instead of include, switch the operator to is not or excludes.
is not works the same way across multiple values: Source is not google or facebook excludes both and shows traffic from every other source. And operators combine across dimensions, so Country is US together with Device is not Desktop shows United States traffic from phones and tablets only.
A few notes on contains and excludes:
- Page, Entry Page, and Exit Page match the URL path only — not the host or query string.
Page contains /blogmatches/blogand/blog/post-1, but not?ref=blog. - For these page dimensions,
containsandexcludesare evaluated at the session level:Page contains /blogkeeps sessions that visited a page whose path contains/blog, andPage excludes /blogkeeps sessions that never visited such a page. Because of this,excludesfor a page filter is not a strict row-by-row opposite ofcontains— it mirrors howisandis notalready behave for pages. - Matching is case-insensitive for standard (ASCII) text such as URLs, sources, and hosts. Values containing non-ASCII or accented characters may not match case-insensitively, so enter those exactly as they appear.
The filter bar also has two controls that aren't tied to a single dimension:
- Conversion event — scope the dashboard to sessions that contained a chosen event, so every metric reflects only visitors who converted. See Scope to Sessions That Converted.
- Exclude bots — a toggle (on by default) that keeps automated traffic out of every metric. See Bots & Traffic Quality.
Managing Filters
Active filters appear as blue pills in the toolbar. Each pill shows the dimension, the operator, and the selected values. For example: Source is google or facebook or Device is not Desktop.
- Remove a single filter by clicking the X on its pill
- Clear all filters by clicking the Clear All button
Filters apply across all dashboard sections at once. When you add a filter, the overview metrics, sources, pages, locations, and devices all update to reflect the filtered data.
Your active filters are also stored in the dashboard URL, so you can bookmark or share a link to return to the exact same view.
Saved Segments
When you find a filter combination you return to often — say, mobile visitors from paid campaigns who converted — you can save it as a named segment instead of rebuilding it each time.
- Save the current view. Click Save segment in the filter bar and give it a name. The segment captures your active filters: source, dimension filters, the conversion event filter, and the Exclude bots toggle. The date range is independent of the segment — you pick it separately each time.
- Recall it in one click. Saved segments appear in a dropdown. Selecting one reapplies the full filter state instantly.
- Shared across your account. Segments are saved to your account, so your team works from the same definitions.
Saved segments turn recurring reporting into a single click — open the dashboard, pick the segment, and every section reflects that audience.
Detail Drawers
Click View Details on any dashboard section to open a detail drawer with the complete dataset.
Detail drawers include:
- Full paginated table showing all results, not just the top rows
- Column sorting: click any column header to sort ascending or descending
- Text search: type to filter rows by name or value
- Row click to filter: click any row to apply it as a dashboard filter and close the drawer
Exporting Data
Click the Export button in the toolbar to download your data.
CSV Export
CSV export generates one file per dimension and view mode. All files are bundled into a single zip archive.
Included files:
| Section | Files |
|---|---|
| Sources | sources-referrer.csv, sources-campaign.csv, sources-source.csv, sources-medium.csv, sources-content.csv, sources-term.csv |
| Pages | pages-top.csv, pages-entry.csv, pages-exit.csv |
| Locations | locations-country.csv, locations-region.csv, locations-city.csv |
| Devices | devices-device.csv, devices-browser.csv, devices-os.csv |
The zip file is named web-analytics-{from}-to-{to}.zip based on your selected date range. If you have filters applied, the exported data reflects those filters.
PDF Export
PDF export generates a snapshot of the full dashboard as it appears, including any active filters. The PDF includes the overview metrics, time-series chart, and all breakdown sections.
Common Use Cases
- Report on one campaign. Filter by Campaign, then export the PDF as a self-contained snapshot for stakeholders.
- Isolate mobile traffic from a paid channel. Combine Device: Mobile with Medium: cpc to see how that exact segment behaves across every section.
- Hand off raw numbers. Export CSV to get one file per dimension, filtered to your current view, for analysis in a spreadsheet or warehouse.
- Compare two segments. Apply a filter and export, clear it and apply another, then compare the two exports side by side.
FAQ
Can I apply two values for the same dimension?
Yes. Select multiple values for a dimension and they combine with OR: Source is google or facebook matches traffic from either. Use the is not operator to exclude values instead. Different dimensions still combine with AND.
Does the export reflect my filters?
Yes. Both CSV and PDF exports reflect whatever filters are active when you export.
How do I save a view to come back to?
Save it as a named segment and recall it from the dropdown in one click. For a quick one-off, the dashboard URL also stores your active filters, so bookmarking or sharing the link returns you to the same view.
Next Steps
- Web Analytics Overview: return to the full feature walkthrough
- Metrics Glossary: definitions and calculation methodology for every metric
Need Help?
Reach out to support@oursprivacy.com if you have questions about filtering or exporting your analytics data.
How is this guide?